
R語言:KEGG富集、可視化教程,附代碼
上篇筆記分享了使用R語言進行GO分析的機械化操作,本篇內容將會分享如何用R語言作通路分析。
緊接上篇筆記內容,作KEGG富集分析用的文件是id.txt文件,即基因ID文件。
1.安裝以下所需要的包
install.packages("colorspace")                ##安裝所需要的包
install.packages("stringi")
source("Bioconductor - Help")
biocLite("DOSE")
biocLite("clusterProfiler")
biocLite("pathview")

2.加載所需包
library("colorspace")    ##加載所需要的包
library("stringi")
library("DOSE")
library("clusterProfiler")
library("org.Hs.eg.db")
library("enrichplot")
library("ggplot2")
3.設置工作路徑并加載“clusterProfiler”包
setwd("C:\\Users\\31791\\Desktop\\KEGG")
library("clusterProfiler")
4.導入id.txt文件,運行以下代碼
rt=read.table("id.txt",sep="\t",header=T,check.names=F)
rt=rt[is.na(rt[,"entrezID"])==F,]
geneFC=rt$logFC
gene=rt$entrezID
names(geneFC)=gene
5.運行以下代碼進行KEGG富集分析,得到KEGG.txt文件
kk <- enrichKEGG(gene = gene, organism = "hsa", pvalueCutoff =0.05, qvalueCutoff =0.05)
write.table(kk, file="KEGG.txt",sep="\t",quote=F,row.names = F)
6.進行可視化繪制氣泡圖和柱狀圖
#柱狀圖
tiff(file="barplot.tiff",width = 20, height = 20, units ="cm",compression="lzw",bg="white",res=600)
barplot(kk, drop = TRUE, showCategory = 20)
dev.off()
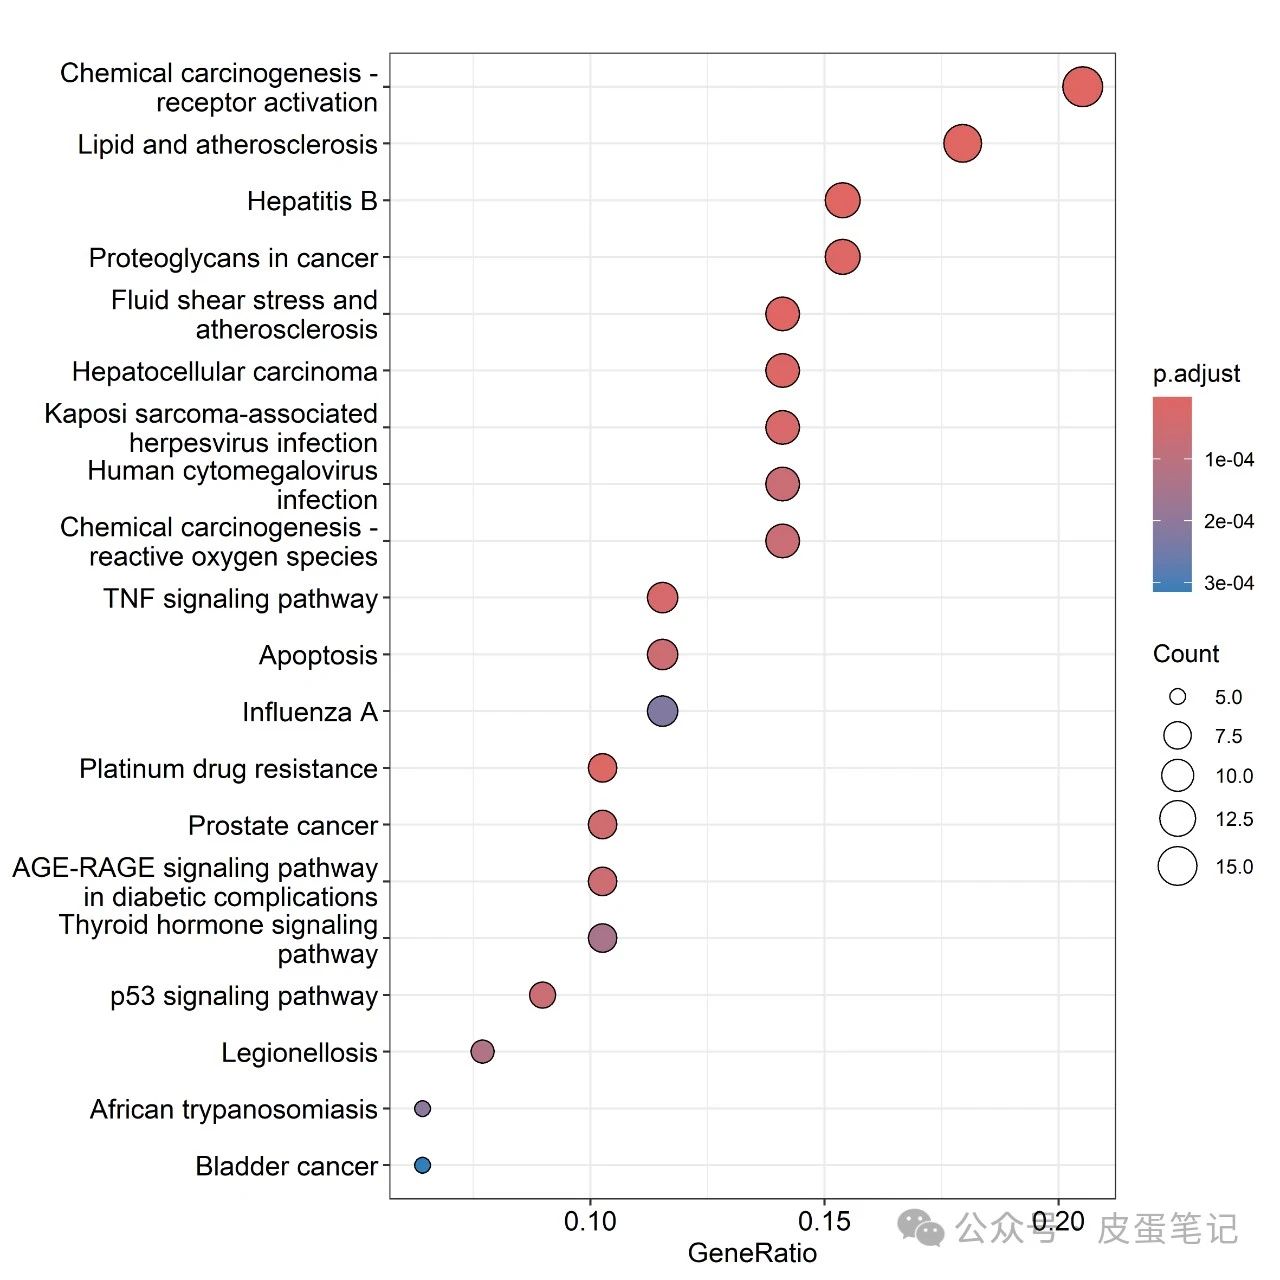
#點圖
tiff(file="dotplot.tiff",width = 20, height = 20, units ="cm",compression="lzw",bg="white",res=600)
dotplot(kk, showCategory = 20)
dev.off()7.通路圖 (利用pathview查閱代謝通路圖并導出)
library("pathview")
keggxls=read.table("KEGG.txt",sep="\t",header=T)
for(i in keggxls$ID){
  pv.out <- pathview(gene.data = geneFC, pathway.id = i, species = "hsa", out.suffix = "pathview")
}
8.結果如下


本公眾號不定時更新,敬請關注與期待。整理不易用你們發正刊(CNS)的金手指為本篇內容點贊支持,本文文件可關注私信回復"KEGG"獲取。
文章轉載自公眾號:皮蛋筆記,歡迎關注,隨時獲取第一手文章內容。

 浙公網安備 33010602011771號