
高性能計算基礎(chǔ)
高性能計算基礎(chǔ)
測試環(huán)境:Debian 12
編譯器:gcc-15.1 clang++-18
1 性能評估指標(biāo)和測試工具
1.1 關(guān)注性能的原因
2005年前后,單個CPU的計算能力達(dá)到飽和。與之相關(guān)的因素在于:
CPU核心頻率停止增長。CPU核心頻率受制于多種因素,重要因素之一就是功耗。如果CPU頻率按照2005年前提升趨勢保持不變,那么今天的CPU每平方毫米的功耗可能比將火箭送入太空的大型噴氣發(fā)動機(jī)還要高。
然而,封裝在單個芯片中晶體管數(shù)量一致在增長。在芯片無法提升到更高的頻率情況下:
- 設(shè)計人員必須將多個處理器內(nèi)核放在同一個芯片上,而不是讓處理器變得更大。這些內(nèi)核的計算能力會隨著內(nèi)核數(shù)量的增加而增加,前提是程序員知道如何恰當(dāng)?shù)厥褂盟鼈儭?/li>
- 更多的晶體管對處理器進(jìn)行了各種非常先進(jìn)的增強(qiáng),這些增強(qiáng)可用于提高性能,同樣要求程序員知道如何正確使用它們。
1.2 程序的性能
效率(Efficiency)和性能(performance)的區(qū)別:
- 高效的程序不會讓可用的資源閑置。
- 高效的程序不會浪費(fèi)資源左不必要的工作。
- 性能總是與一些指標(biāo)有關(guān)。最常見的就是速度。
- 效率反映了計算資源的利用率,是實現(xiàn)良好性能的方式之一。
性能指標(biāo):
- 吞吐量(throughput)指標(biāo)
- 功耗指標(biāo)
- 實時應(yīng)用性能(尾部延時 tail latency)
- 上下文環(huán)境
如何編寫高性能應(yīng)用程序:
- 選擇正確的算法
- 有效利用CPU資源
- 有效使用內(nèi)存
- 避免不必要的計算
- 有效地使用并發(fā)和多線程
- 有效地使用編程語言,避免低效率
- 衡量性能和解釋結(jié)果
總體上可總結(jié)為:有效地使用硬件;有效地使用編程語言;有效地使用編譯器來生成最高效代碼;獲取良好的量化性能數(shù)據(jù)。
1.3 性能基準(zhǔn)測試
1.3.1 C++計時器
- std::chrono::system_clock
1.3.2 高分辨率計時器
- clock_gettime:要測量CPU時間,必須使用特定于操作系統(tǒng)的系統(tǒng)調(diào)用。在Linux和其他POSIX兼容系統(tǒng)上,開源使用clock_gettime()調(diào)用來訪問硬件高分辨率計時器。
- 實時時鐘:CLOCK_REALTIME
- 測量當(dāng)前程序使用的CPU時間:CLOCK_PROCESS_CPUTIME_ID
- 測量調(diào)用線程使用的時間:CLOCK_THREAD_CPUTIME_ID
測試代碼:
#include <chrono>
#include <future>
#include <iostream>
#include <memory>
#include <random>
#include <vector>

using std::chrono::duration_cast;
using std::chrono::milliseconds;
using std::chrono::system_clock;
using std::cout;
using std::endl;
using std::minstd_rand;
using std::unique_ptr;
using std::vector;

double duration(timespec a,timespec b)
{
    return a.tv_sec-b.tv_sec+1e-9*(a.tv_nsec-b.tv_nsec);
}
int main()
{
    timespec rt0,ct0,tt0;
    clock_gettime(CLOCK_REALTIME,&rt0);
    clock_gettime(CLOCK_PROCESS_CPUTIME_ID,&ct0);
    clock_gettime(CLOCK_THREAD_CPUTIME_ID,&tt0);

    constexpr double X =1e6;
    double s = 0;
    double s1 =0;

    //std::this_thread::sleep_for(std::chrono::seconds(1));

    auto f = std::async(std::launch::async,[&]{
        for(double x = 0; x<X; x+=0.1)
        {
            s+=sin(x);
        }
    });

    for(double x =0;x<X;x+=0.1)
        s1 += sin(x);

    f.wait();

    timespec rt1,ct1,tt1;
    clock_gettime(CLOCK_REALTIME,&rt1);
    clock_gettime(CLOCK_PROCESS_CPUTIME_ID,&ct1);
    clock_gettime(CLOCK_THREAD_CPUTIME_ID,&tt1);

    cout<<"Real time:"<<duration(rt1,rt0)<<"s, CPU time:"<<duration(ct1,ct0)<<"s, Thread time:"<<duration(tt1,tt0)<<"s"<<endl;

    return 0;
}
1.4 性能分析
1.4.1 perf性能分析器
此性能分析器使用硬件性能計數(shù)器和基于時間采樣,因此不需要對代碼進(jìn)行任何檢測。運(yùn)行該性能分析器最簡單的方法是手機(jī)整個程序的計數(shù)器值。下圖是用perf stat命令完成的。
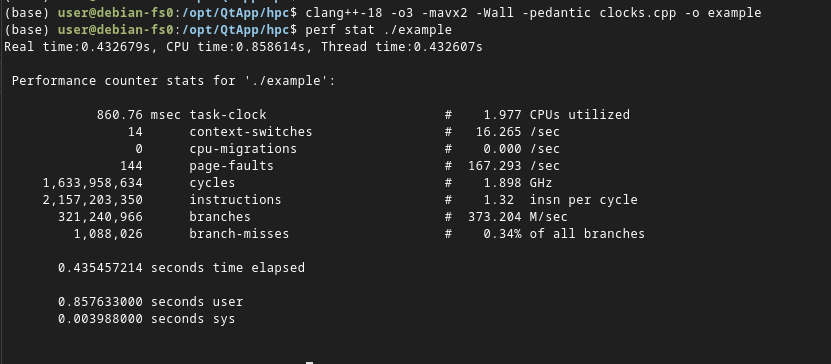
本示例中,程序運(yùn)行860ms,并執(zhí)行了超過21億條指令(instruction)。還顯示了page-faults(頁面錯誤)和branches(分支)
也可以執(zhí)行:
perf stat -e cycles,instructions,branches,branch-misses,cache-references,cache-misses ./example
輸出:
Real time:0.522098s, CPU time:0.933204s, Thread time:0.411307s

 Performance counter stats for './example':

     1,646,305,868      cycles
     2,155,999,666      instructions                     #    1.31  insn per cycle
       320,999,448      branches
         1,070,837      branch-misses                    #    0.33% of all branches
        66,777,267      cache-references
            79,258      cache-misses                     #    0.119 % of all cache refs

       0.524856154 seconds time elapsed

       0.936146000 seconds user
       0.000000000 seconds sys
- cycles:周期時間,為CPU頻率的倒數(shù)。為了進(jìn)行準(zhǔn)確的性能分析和基礎(chǔ)測試,建議禁用省電模式和其他可能導(dǎo)致CPU時間變化的功能。
- instruction:指令計數(shù)器,測量已執(zhí)行的處理器指令數(shù)。該CPU每個周期平均執(zhí)行1.31條指令。
- branches:分支,即條件指令,每個if語句和每個帶條件的for循環(huán)都將至少生成這些指令之一。
- branch-misses:分支未命中,目前,從性能的角度來看,這是一個成本很高且不受歡迎的事件。
- cache-references:緩存引用,統(tǒng)計的是CPU從內(nèi)存中獲取某些數(shù)據(jù)所需的次數(shù)。
- cache-misses:根據(jù)處理器和內(nèi)存的狀態(tài),這種獲取可能非常快,也非常慢。對于非常慢的,計入cache-misses(緩存未命中)。緩存未命中也是一個成本很高的事件。
編譯代碼后:
clang++-18 -g -o3 -mavx2 -Wall -pedantic clocks.cpp -o example
可以使用perf record錄制性能分析樣本:
perf record ./example
然后使用perf report 分析樣本
perf report
1.4.2 Google Performance性能分析器
安裝:
sudo apt-get install google-perftools libgoogle-perftools-dev
Google CPU性能分析器可以使用硬件性能計數(shù)器,還需要代碼的鏈接時檢測。要準(zhǔn)備用于性能分析的代碼,必須將其與性能分析器庫鏈接(-lprofiler)。編譯指令如下:
clang++-18 -g -o3 -mavx2 -Wall -pedantic ./clocks.cpp -lprofiler -o example
獲取分析數(shù)據(jù):
CPUPROFILE=prof.data CPUPROFILE_FREQUENCY=1000 ./example
采樣交互模式使用性能分析器:
google-pprof ./example prof.data
輸出:
sing local file ./example.
Using local file prof.data.
Welcome to pprof!  For help, type 'help'.
(pprof) text
Total: 160 samples
      50  31.2%  31.2%      116  72.5% main
      30  18.8%  50.0%       30  18.8% do_sin
      24  15.0%  65.0%       24  15.0% reduce_sincos
      18  11.2%  76.2%       18  11.2% do_cos
      14   8.8%  85.0%       44  27.5% main::$_0::operator
      13   8.1%  93.1%       13   8.1% __sin_fma
       7   4.4%  97.5%        7   4.4% libc_feholdsetround_sse_ctx
       3   1.9%  99.4%        3   1.9% do_sincos
       1   0.6% 100.0%        1   0.6% libc_feresetround_sse_ctx
       0   0.0% 100.0%       44  27.5% __gthread_once
(pprof)
查看用執(zhí)行時間百分比注釋的所有函數(shù)的摘要信息:
(pprof) text --lines
Total: 160 samples
      33  20.6%  20.6%       99  61.9% main /opt/QtApp/hpc/./clocks.cpp:41
      17  10.6%  31.2%       17  10.6% main /opt/QtApp/hpc/./clocks.cpp:40
       9   5.6%  36.9%       39  24.4% main::$_0::operator /opt/QtApp/hpc/./clocks.cpp:36
       8   5.0%  41.9%        8   5.0% do_sin ./math/../sysdeps/ieee754/dbl-64/s_sin.c:144
       7   4.4%  46.2%        7   4.4% libc_feholdsetround_sse_ctx ./math/../sysdeps/x86/fpu/fenv_private.h:416
       7   4.4%  50.6%        7   4.4% reduce_sincos ./math/../sysdeps/ieee754/dbl-64/s_sin.c:165
       6   3.8%  54.4%        6   3.8% do_sin ./math/../sysdeps/ieee754/dbl-64/s_sin.c:129
       5   3.1%  57.5%        5   3.1% __sin_fma ./math/../sysdeps/x86_64/fpu/multiarch/s_sin-fma.c:201
       5   3.1%  60.6%        5   3.1% do_cos ./math/../sysdeps/ieee754/dbl-64/s_sin.c:114
       5   3.1%  63.8%        5   3.1% main::$_0::operator /opt/QtApp/hpc/./clocks.cpp:34
(pprof)
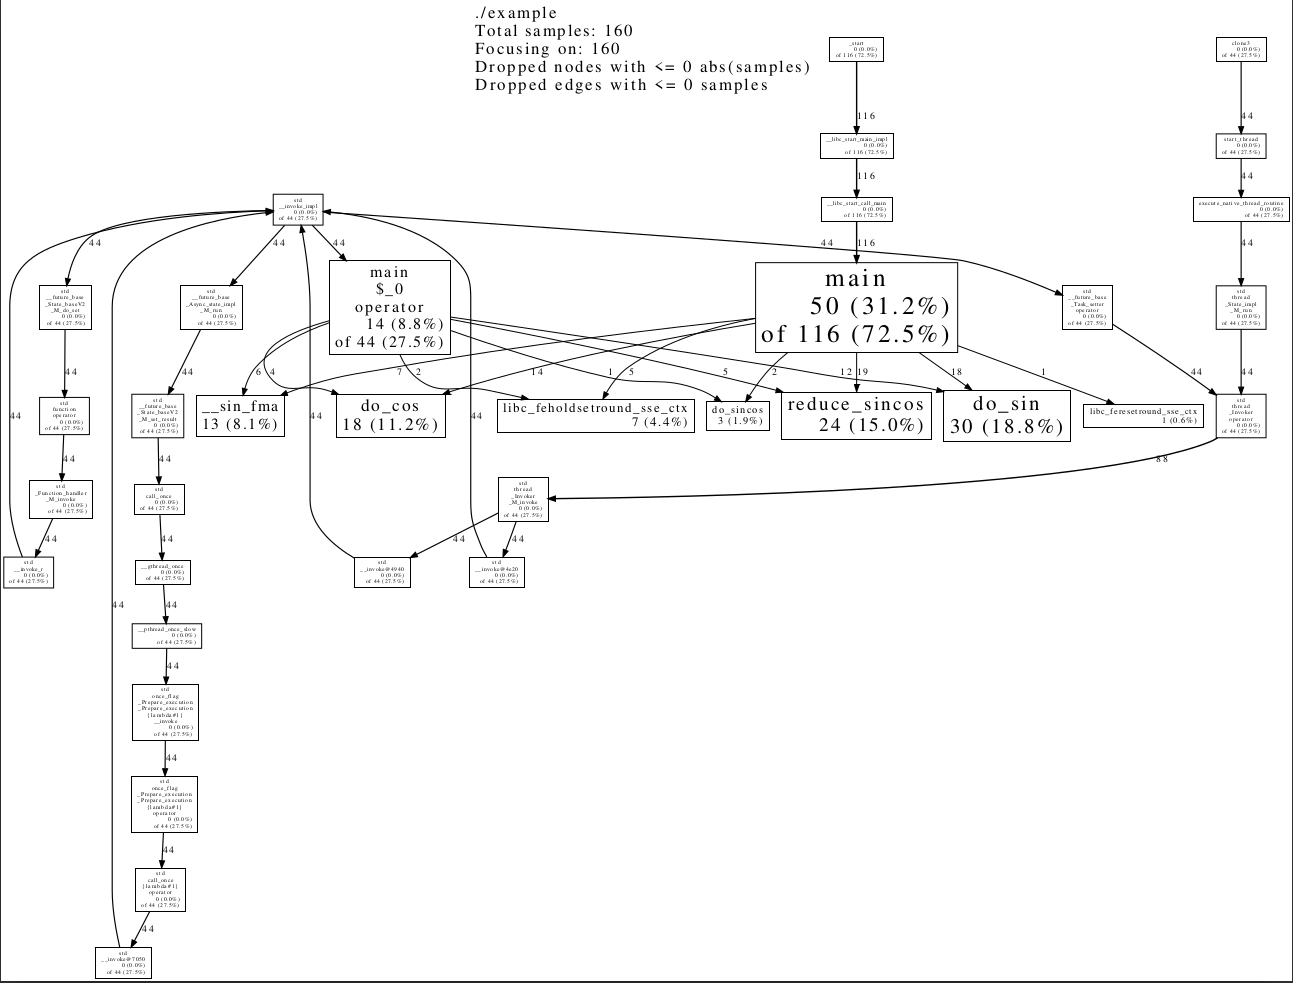
性能分析器通常使用調(diào)用圖(call graph)來呈現(xiàn)此信息:調(diào)用方(caller)和被調(diào)用方(callee)是圖中的節(jié)點。在這個圖中我們可以了解在每個函數(shù)和代碼行上執(zhí)行了多少時間,還可以知道每個調(diào)用鏈花了多少時間。
google-pprof --pdf ./example prof.data >prof.pdf
1.4.3 收集性能數(shù)據(jù)的方法(微基準(zhǔn)測試)
- 微基準(zhǔn)測試的基礎(chǔ)知識:微基準(zhǔn)測試 (micro-benchmark)一種對函數(shù)進(jìn)行調(diào)用并測量結(jié)果,也就是運(yùn)行一小段代碼并測量其性能。
- 微基準(zhǔn)測試工具:Google Benchmark。
Google Benchmark安裝:
sudo apt install libbenchmark-dev
Google Benchmark用法:
#include <benchmark/benchmark.h>
#include <string>
#include <sstream>
#include <vector>
#include <cmath>

// 示例1:測試不同的字符串拼接方法
static void BM_StringPlusOperator(benchmark::State& state) {
    for (auto _ : state) {
        std::string result;
        for (int i = 0; i < state.range(0); ++i) {
            result += "hello";
        }
        benchmark::DoNotOptimize(result);
    }
}
// 正確的參數(shù)設(shè)置方式
BENCHMARK(BM_StringPlusOperator)->RangeMultiplier(2)->Range(1, 1024);

static void BM_StringAppend(benchmark::State& state) {
    for (auto _ : state) {
        std::string result;
        for (int i = 0; i < state.range(0); ++i) {
            result.append("hello");
        }
        benchmark::DoNotOptimize(result);
    }
}
BENCHMARK(BM_StringAppend)->RangeMultiplier(2)->Range(1, 1024);

static void BM_StringStream(benchmark::State& state) {
    for (auto _ : state) {
        std::stringstream ss;
        for (int i = 0; i < state.range(0); ++i) {
            ss << "hello";
        }
        std::string result = ss.str();
        benchmark::DoNotOptimize(result);
    }
}
BENCHMARK(BM_StringStream)->RangeMultiplier(2)->Range(1, 1024);

// 示例2:測試向量操作性能
static void BM_VectorPushBack(benchmark::State& state) {
    for (auto _ : state) {
        std::vector<int> vec;
        vec.reserve(state.range(0));
        for (int i = 0; i < state.range(0); ++i) {
            vec.push_back(i);
        }
        benchmark::DoNotOptimize(vec);
    }
}
BENCHMARK(BM_VectorPushBack)->RangeMultiplier(2)->Range(8, 1024);

static void BM_VectorEmplaceBack(benchmark::State& state) {
    for (auto _ : state) {
        std::vector<int> vec;
        vec.reserve(state.range(0));
        for (int i = 0; i < state.range(0); ++i) {
            vec.emplace_back(i);
        }
        benchmark::DoNotOptimize(vec);
    }
}
BENCHMARK(BM_VectorEmplaceBack)->RangeMultiplier(2)->Range(8, 1024);

// 示例3:帶有復(fù)雜計算的測試
static void BM_ComplexCalculation(benchmark::State& state) {
    const int size = state.range(0);
    std::vector<double> data(size);

    for (int i = 0; i < size; ++i) {
        data[i] = i * 0.1;
    }

    for (auto _ : state) {
        double sum = 0.0;
        for (int i = 0; i < size; ++i) {
            sum += std::sin(data[i]) * std::cos(data[i]);
        }
        benchmark::DoNotOptimize(sum);
    }
}
BENCHMARK(BM_ComplexCalculation)->RangeMultiplier(4)->Range(64, 4096);

// 示例4:使用自定義計數(shù)器
static void BM_MatrixMultiplication(benchmark::State& state) {
    const int n = state.range(0);

    for (auto _ : state) {
        // 簡化版的矩陣乘法,避免大量內(nèi)存分配影響測試結(jié)果
        double sum = 0.0;
        for (int i = 0; i < n; ++i) {
            for (int j = 0; j < n; ++j) {
                for (int k = 0; k < n; ++k) {
                    sum += i * k + j * k; // 模擬計算
                }
            }
        }

        benchmark::DoNotOptimize(sum);

        // 正確的計數(shù)器設(shè)置方式
        state.counters["FLOPs"] = benchmark::Counter(
            static_cast<double>(2 * n * n * n),
            benchmark::Counter::kIsRate
        );
        state.counters["MatrixSize"] = n;
    }
}
// 使用ArgsProduct測試多個參數(shù)組合
BENCHMARK(BM_MatrixMultiplication)->Args({10})->Args({20})->Args({30});

// 示例5:簡單的循環(huán)測試(無參數(shù))
static void BM_EmptyLoop(benchmark::State& state) {
    for (auto _ : state) {
        // 空循環(huán),測試基準(zhǔn)開銷
    }
}
BENCHMARK(BM_EmptyLoop);

// 示例6:內(nèi)存訪問模式測試
static void BM_MemoryAccess(benchmark::State& state) {
    const int size = state.range(0);
    std::vector<int> data(size, 1);

    for (auto _ : state) {
        int sum = 0;
        // 順序訪問
        for (int i = 0; i < size; ++i) {
            sum += data[i];
        }
        benchmark::DoNotOptimize(sum);
    }
}
BENCHMARK(BM_MemoryAccess)->Arg(1000)->Arg(10000)->Arg(100000);

// 示例7:使用模板的基準(zhǔn)測試
template<typename T>
static void BM_TemplateTest(benchmark::State& state) {
    for (auto _ : state) {
        T result = T();
        for (int i = 0; i < state.range(0); ++i) {
            result += static_cast<T>(i);
        }
        benchmark::DoNotOptimize(result);
    }
}

// 注冊模板測試
BENCHMARK_TEMPLATE(BM_TemplateTest, int)->Range(1, 1000);
BENCHMARK_TEMPLATE(BM_TemplateTest, double)->Range(1, 1000);
BENCHMARK_TEMPLATE(BM_TemplateTest, float)->Range(1, 1000);

BENCHMARK_MAIN();
編譯:
clang++-18 -O3 -I/usr/local/include -L/usr/local/lib ./test_benchmark.cpp -lbenchmark -lpthread -o benchmark_example
如果能看到輸出的性能測試結(jié)果,就說明 Google Benchmark 庫已經(jīng)成功安裝并可以正常工作了:
 ./benchmark_example
2025-09-23T23:12:40-10:00
Running ./benchmark_example
Run on (4 X 3900 MHz CPU s)
CPU Caches:
  L1 Data 32 KiB (x4)
  L1 Instruction 32 KiB (x4)
  L2 Unified 256 KiB (x4)
  L3 Unified 6144 KiB (x1)
Load Average: 0.12, 0.44, 0.45
***WARNING*** CPU scaling is enabled, the benchmark real time measurements may be noisy and will incur extra overhead.
***WARNING*** Library was built as DEBUG. Timings may be affected.
-----------------------------------------------------------------------
Benchmark                             Time             CPU   Iterations
-----------------------------------------------------------------------
BM_StringPlusOperator/1            14.8 ns         14.8 ns     41141692
BM_StringPlusOperator/2            23.5 ns         23.5 ns     27457916
BM_StringPlusOperator/4            75.6 ns         75.6 ns      8516886
BM_StringPlusOperator/8             133 ns          133 ns      4835163
BM_StringPlusOperator/16            228 ns          228 ns      2924758
BM_StringPlusOperator/32            368 ns          368 ns      1816380
BM_StringPlusOperator/64            700 ns          700 ns       905954
BM_StringPlusOperator/128          1245 ns         1245 ns       525369
BM_StringPlusOperator/256          2319 ns         2318 ns       291399
BM_StringPlusOperator/512          4341 ns         4341 ns       159391
BM_StringPlusOperator/1024         8428 ns         8428 ns        77097
BM_StringAppend/1                  10.8 ns         10.8 ns     62091856
BM_StringAppend/2                  18.6 ns         18.6 ns     36557304
BM_StringAppend/4                  67.9 ns         67.9 ns      9695255
BM_StringAppend/8                   126 ns          126 ns      5336449
BM_StringAppend/16                  214 ns          214 ns      3143867
BM_StringAppend/32                  379 ns          379 ns      1824693
BM_StringAppend/64                  681 ns          681 ns       935922
BM_StringAppend/128                1202 ns         1202 ns       549609
1.4.4 案例解析
- 測試代碼
#include <benchmark/benchmark.h>
#include <memory>
#include <cstring>

bool compare_int(const char* s1,const char* s2)
{
    char c1,c2;
    for(int i1=0,i2=0;;++i1,++i2)
    {
        c1=s1[i1];c2=s2[i2];
        if(c1!=c2)
            return c1>c2;
    }
}
void BM_loop_int(benchmark::State& state)
{
    const unsigned int N = state.range(0);
    std::unique_ptr<char[]>s(new char[2*N]);
    ::memset(s.get(),'a',2*N*sizeof(char));
    s[2*N-1] =0;
    const char* s1 = s.get(),*s2=s1+N;
    for(auto _:state){
        benchmark::DoNotOptimize(compare_int(s1,s2));
    }
    state.SetItemsProcessed(N*state.iterations());
}
BENCHMARK(BM_loop_int)->Arg(1<<20);
BENCHMARK_MAIN();
- 編譯指令:
clang++-18 -g -O3 -mavx2 -Wall -pedantic -I/usr/local/include -L/usr/local/lib ./10_compare_mbm.cpp -lbenchmark -lpthread -lrt -lm -o 10_compare_mbm
- 輸出:
 ./10_compare_mbm
2025-09-23T23:31:56-10:00
Running ./10_compare_mbm
Run on (4 X 3900 MHz CPU s)
CPU Caches:
  L1 Data 32 KiB (x4)
  L1 Instruction 32 KiB (x4)
  L2 Unified 256 KiB (x4)
  L3 Unified 6144 KiB (x1)
Load Average: 0.06, 0.68, 0.72
***WARNING*** CPU scaling is enabled, the benchmark real time measurements may be noisy and will incur extra overhead.
***WARNING*** Library was built as DEBUG. Timings may be affected.
------------------------------------------------------------------------------
Benchmark                    Time             CPU   Iterations UserCounters...
------------------------------------------------------------------------------
BM_loop_int/1048576     641864 ns       641837 ns         1055 items_per_second=1.63371G/s
- 解析:
每個Google Benchmark基準(zhǔn)測試程序都必須包含該庫頭文件<benchmark/benchmark.h>。BM_loop_int首先設(shè)置運(yùn)行代碼的輸入數(shù)據(jù),本示例中,代碼的輸入是字符串,所以需要分配和初始化字符串。函數(shù)退出時要清理初始化數(shù)據(jù),本例中使用std::unique_ptr對象的析構(gòu)函數(shù)執(zhí)行。
BENCHMARK指定要傳遞給基準(zhǔn)測試fixture的任何參數(shù)的地方。影響基準(zhǔn)測試的參數(shù)和其他選項將使用重載的箭頭運(yùn)算符傳遞。
代碼清單中沒有main函數(shù),而是使用宏BENCHMARK_MAIN()。用來完成設(shè)置基準(zhǔn)測試環(huán)境、注冊基準(zhǔn)測試和執(zhí)行它們所有必要的工作。
benchmark::DoNotOptimize()包裝函數(shù)的作用類似使用volatile,用于確保編譯器不會優(yōu)化對compare_int()的整個調(diào)用。實際上并沒關(guān)閉任何優(yōu)化,特別是括號里面的代碼照常優(yōu)化。
編譯時需要指定Google Benchmark 頭文件和庫文件路,Google Benchmark庫libbenchmark庫以及若干額外的庫。
一旦被調(diào)用,基準(zhǔn)測試程序會打印關(guān)于正在運(yùn)行的系統(tǒng)的信息,然后執(zhí)行每個已注冊的fixture。
每個基準(zhǔn)測試fixture和一組參數(shù)都將得到一行輸出。該報告包括基準(zhǔn)測試循環(huán)主體單次執(zhí)行的平均實時時間和平均CPU時間、循環(huán)執(zhí)行次數(shù)以及附加到報告中的讓其他統(tǒng)計信息(本例中時比較函數(shù)每秒處理的字符數(shù),每個超過1.6G個字符)。
這些數(shù)據(jù)在每次運(yùn)行中相差多少,如果使用正確的命令行參數(shù)啟用統(tǒng)計信息收集,則基準(zhǔn)測試庫可以為我們計算出結(jié)果。例如,每重復(fù)基準(zhǔn)測試10次并報告結(jié)果,則運(yùn)行的基準(zhǔn)測試將如下所示:
./10_compare_mbm --benchmark_repetitions=10 --benchmark_report_aggregates_only=true
2025-09-24T00:04:08-10:00
Running ./10_compare_mbm
Run on (4 X 3900 MHz CPU s)
CPU Caches:
  L1 Data 32 KiB (x4)
  L1 Instruction 32 KiB (x4)
  L2 Unified 256 KiB (x4)
  L3 Unified 6144 KiB (x1)
Load Average: 0.06, 0.03, 0.09
***WARNING*** CPU scaling is enabled, the benchmark real time measurements may be noisy and will incur extra overhead.
***WARNING*** Library was built as DEBUG. Timings may be affected.
-------------------------------------------------------------------------------------
Benchmark                           Time             CPU   Iterations UserCounters...
-------------------------------------------------------------------------------------
BM_loop_int/1048576_mean       485082 ns       485056 ns           10 items_per_second=2.18225G/s
BM_loop_int/1048576_median     458741 ns       458722 ns           10 items_per_second=2.28596G/s
BM_loop_int/1048576_stddev      52421 ns        52414 ns           10 items_per_second=211.207M/s
BM_loop_int/1048576_cv          10.81 %         10.81 %            10 items_per_second=9.68%
如此,我們可以對子串比較函數(shù)的不同變體進(jìn)行基準(zhǔn)測試,并找出哪個變體最快。
2 CPU流水線、推測窒息和分支優(yōu)化
2.1 指令級并行(ILP, instruction-level parallelism)
只要操作數(shù)已經(jīng)在寄存器中,處理器就可以一次執(zhí)行若干個操作。當(dāng)然,可以執(zhí)行的操作數(shù)量是有限的,因為處理器能夠進(jìn)行整數(shù)計算的執(zhí)行單元有限。盡管如此,通過在一次迭代中添加越來越多的指令來嘗試將CPU推向極限是有益的。
如下兩個迭代執(zhí)行時間是差不多的:
//迭代一
for(size_t i =0;i<N;++i)
 {
            a1 +=p1[i]+p2[i];
 }
//迭代二
for(size_t i =0;i<N;++i)
 {
            a1 +=p1[i]+p2[i];
            a2 +=p1[i]*p2[i];
            a3 +=p1[i]<<2;
            a4 +=p2[i]-p1[i];
            a5 +=(p2[i]<<2)*p2[i];
            a6 +=(p2[i]-3)*p1[i];
 }
測試代碼如下:
#include <benchmark/benchmark.h>
#include <vector>
void BM_add(benchmark::State& state)
{
    srand(1);
    const unsigned int N = state.range(0);
    std::vector<unsigned long> v1(N),v2(N);

    for(size_t i=0;i<N;++i)
    {
        v1[i]=rand();
        v2[i]=rand();
    }

    unsigned long* p1= v1.data();
    unsigned long* p2 = v2.data();
    for([[maybe_unused]]auto _:state)
    {
        unsigned long a1 =0;
        for(size_t i =0;i<N;++i)
        {
            a1 +=p1[i]+p2[i];
        }
        benchmark::DoNotOptimize(a1);
        benchmark::ClobberMemory();
    }
    state.SetItemsProcessed(N*state.iterations());
}

void BM_ILP(benchmark::State& state)
{
    srand(1);
    const unsigned int N = state.range(0);
    std::vector<unsigned long> v1(N),v2(N);

    for(size_t i=0;i<N;++i)
    {
        v1[i]=rand();
        v2[i]=rand();
    }

    unsigned long* p1= v1.data();
    unsigned long* p2 = v2.data();

    for([[maybe_unused]]auto _:state)
    {
        unsigned long a1 =0,a2=0,a3=0,a4=0,a5=0,a6=0;
        for(size_t i =0;i<N;++i)
        {
            a1 +=p1[i]+p2[i];
            a2 +=p1[i]*p2[i];
            a3 +=p1[i]<<2;
            a4 +=p2[i]-p1[i];
            a5 +=(p2[i]<<2)*p2[i];
            a6 +=(p2[i]-3)*p1[i];
        }
        benchmark::DoNotOptimize(a1);
        benchmark::DoNotOptimize(a2);
        benchmark::DoNotOptimize(a3);
        benchmark::DoNotOptimize(a4);
        benchmark::DoNotOptimize(a5);
        benchmark::DoNotOptimize(a6);
        benchmark::ClobberMemory();
    }
    state.SetItemsProcessed(N*state.iterations());
}
void BM_mutiply(benchmark::State& state)
{
    srand(1);
    const unsigned int N = state.range(0);
    std::vector<unsigned long> v1(N),v2(N);

    for(size_t i=0;i<N;++i)
    {
        v1[i]=rand();
        v2[i]=rand();
    }

    unsigned long* p1= v1.data();
    unsigned long* p2 = v2.data();

    for([[maybe_unused]]auto _:state)
    {
        unsigned long a1 =0;
        for(size_t i =0;i<N;++i)
        {
            a1 +=p1[i]*p2[i];
        }
        benchmark::DoNotOptimize(a1);
        benchmark::ClobberMemory();
    }
    state.SetItemsProcessed(N*state.iterations());
}

BENCHMARK(BM_add)->Arg(1<<22);
BENCHMARK(BM_ILP)->Arg(1<<22);
BENCHMARK(BM_mutiply)->Arg(1<<22);

BENCHMARK_MAIN();
輸出:
./superscalar
2025-09-24T19:48:37-10:00
Running ./superscalar
Run on (4 X 3900 MHz CPU s)
CPU Caches:
  L1 Data 32 KiB (x4)
  L1 Instruction 32 KiB (x4)
  L2 Unified 256 KiB (x4)
  L3 Unified 6144 KiB (x1)
Load Average: 0.01, 0.08, 0.18
***WARNING*** CPU scaling is enabled, the benchmark real time measurements may be noisy and will incur extra overhead.
***WARNING*** Library was built as DEBUG. Timings may be affected.
-----------------------------------------------------------------------------
Benchmark                   Time             CPU   Iterations UserCounters...
-----------------------------------------------------------------------------
BM_add/4194304        5793066 ns      5792942 ns          100 items_per_second=724.037M/s
BM_ILP/4194304        8123805 ns      8122965 ns           88 items_per_second=516.351M/s
BM_mutiply/4194304    5256256 ns      5256241 ns          100 items_per_second=797.966M/s
3 現(xiàn)代內(nèi)存架構(gòu)、訪問模式以及對算法和數(shù)據(jù)結(jié)構(gòu)設(shè)計的影響
4 多線程和并發(fā)工作原理
5 鎖、無鎖和無等待及并發(fā)數(shù)據(jù)結(jié)構(gòu)的基礎(chǔ)知識
5.1 鎖
5.2 無鎖
5.3 無等待
5.4 并發(fā)數(shù)據(jù)結(jié)構(gòu)基礎(chǔ)知識
使用多線程的并發(fā)程序需要線程安全的數(shù)據(jù)結(jié)構(gòu)。線程安全的數(shù)據(jù)結(jié)構(gòu)是指:如果一個數(shù)據(jù)結(jié)構(gòu)可以被多個線程同時使用而且沒有任何數(shù)據(jù)競爭(線程之間共享),那么它就是線程安全的:
- 把標(biāo)準(zhǔn)抬的很高,例如:沒有一個STL容器被認(rèn)為是線程安全的。
- 帶來的性能成本非常高。
- 通常是不必要的,沒必要因此多花成本。
- 最重要的是,在許多情況下完全用不上
對象被一個線程單獨(dú)占用時不需要線程安全。
只要線程不修改對象,那么許多數(shù)據(jù)結(jié)構(gòu)在多線程代碼中使用是安全的。用例:std::shared_ptr,當(dāng)復(fù)制共享指針時,復(fù)制的對象不會被修改,它通過const應(yīng)用被傳遞給新指針的構(gòu)造函數(shù),同時對象中的引用計數(shù)必須遞增。意味著復(fù)制的來源發(fā)送了變化。在這種情況下共享指針是線程安全的,但也有性能成本。
線程安全的最高級別通常稱為強(qiáng)線程安全保證(strong thread safety guarantee):提供此保證的對象可以被多個線程并發(fā)使用而不會導(dǎo)致數(shù)據(jù)競爭或其他未定義行為。
下一個級別稱為弱線程安全保證(weak thread safety guarantee):意味著,首先,只要所有線程都被限制為只讀訪問(調(diào)用類的const成員函數(shù)),那么提供該保證的對象就可以同時被多個線程訪問。其次,人后線程只要可以獨(dú)占訪問一個對象,即可對其執(zhí)行任何有效操作,而不管其他線程同時在做什么。
- 線程安全(thread-safe):提供強(qiáng)線程安全保證的類稱為線程安全(thread-safe)。
- 線程兼容(thread compatible):僅提供弱線程保證的類被稱為線程兼容(thread compatible)。大多數(shù)STL容器提供這樣的保證:如果某個容器是一個線程本地容器,則可以安任何有效方式使用它;如果某個容器對象是共享的,則只能調(diào)用const成員函數(shù)。
- 線程對立(thread-hostile):根本不提供任何保證的類被稱為線程對立(thread-hostile)。
6 線程安全的數(shù)據(jù)結(jié)構(gòu)(并發(fā)數(shù)據(jù)結(jié)構(gòu))
6.1 最好的線性安全性
最好的解決方案是在每個線程上維護(hù)本地計數(shù)并且只增加共享計數(shù)一次。
對比如下偽代碼(注:第二種寫法由于第一種):
寫法一:
std::atomic<unsigned log> count;

//在某個線程上
for(...counting loop...)
{
    if(...found...)
     {
         count.fetch_add(1,std::memory_order_relaxed);
     }
}
寫法二:
unsigned long count;
std::mutex M;
//在某個線程上
unsigned long local_count =0;
for(...counting loop...)
{
    if(...found...)
    {
        ++local_count;
    }
}
std::lock_guard<std::mutex> L(M);
count +=local_count;
6.2 線程安全棧
C++標(biāo)準(zhǔn)庫提供了std::stack容器。所有的C++容器都提供弱線程安全保證:一個只讀容器可以被多個線程安全訪問。也就是只要沒有線程調(diào)用任何非const方法,任何數(shù)量的線程都可以同時調(diào)用任何const方法。
當(dāng)至少有一個線程正在修改占,而我們需要更強(qiáng)的保證。最直接的方法是利用互斥鎖保護(hù)類的每個成員函數(shù)。這可以在應(yīng)用程序級別完成,但這種實現(xiàn)不強(qiáng)制線程安全,容易出錯,也難于調(diào)試,因為鎖與容器無關(guān)聯(lián)。
所以,更好的選擇就是使用我們自己的棧類包裝。
#include <stack>
#include <mutex>
#include <optional>
#include <benchmark/benchmark.h>

template<typename T>
class mt_stack{
private:
    std::stack<T> s_;
    std::mutex l_;
public:
    mt_stack() = default;
    std::optional<T> pop()
    {
        std::lock_guard g(l_);
        if(s_.empty()) {
            return std::optional<T>(std::nullopt);
        }else{
            std::optional<T> res(std::move(s_.top()));
            s_.pop();
            return res;
        }
    }
    void push(const T& v)
    {
        std::lock_guard g(l_);
        s_.push(v);
    }
};
7 C++標(biāo)準(zhǔn)中的并發(fā)編程特性
8 零拷貝
9 編譯器優(yōu)化基礎(chǔ)知識
10 高性能編程設(shè)計總結(jié)

 浙公網(wǎng)安備 33010602011771號