
jmeter 高級(jí)操作
一、連接mysql
1、下載mysql 連接 jmeter 的jar 包,點(diǎn)擊第二個(gè):https://dev.mysql.com/downloads/file/?id=537130
2、在測(cè)試計(jì)劃中上傳

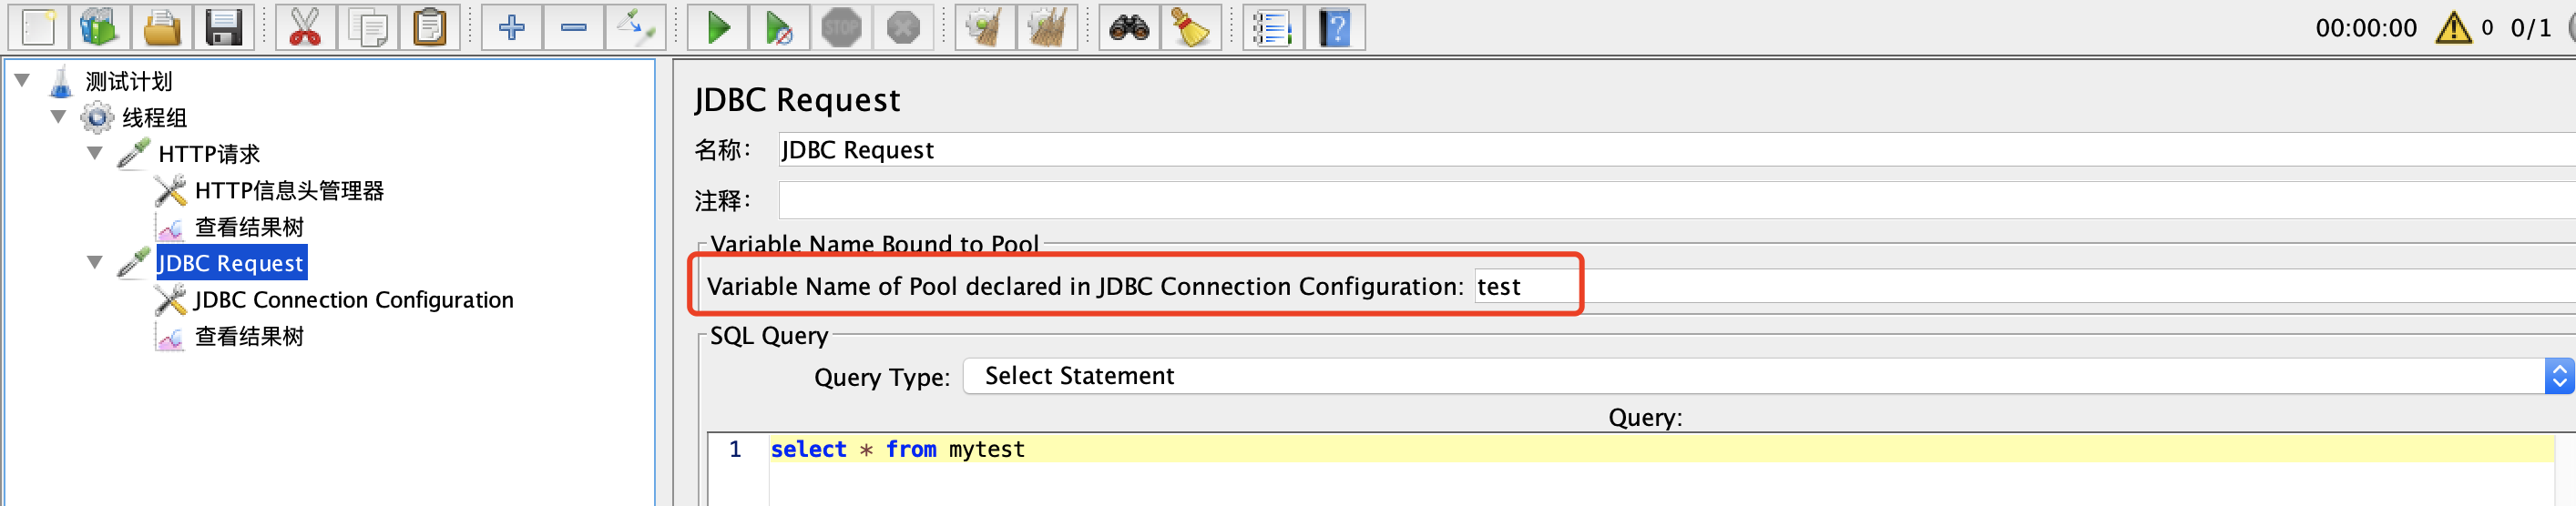
3、連接數(shù)據(jù)庫(kù)、輸入連接池名稱(chēng)
jdbc:mysql://localhost:3306/testdata

二、正則表達(dá)式

三、csv 參數(shù)化設(shè)置

四、下載插件
https://jmeter-plugins.org/install/Install/
將插件放入該目錄 lib/ext
jmeter——選項(xiàng)——JMeter Plugins Manger——下載 3 Basic Graphs、Custom Thread Groups
五、下載influxd
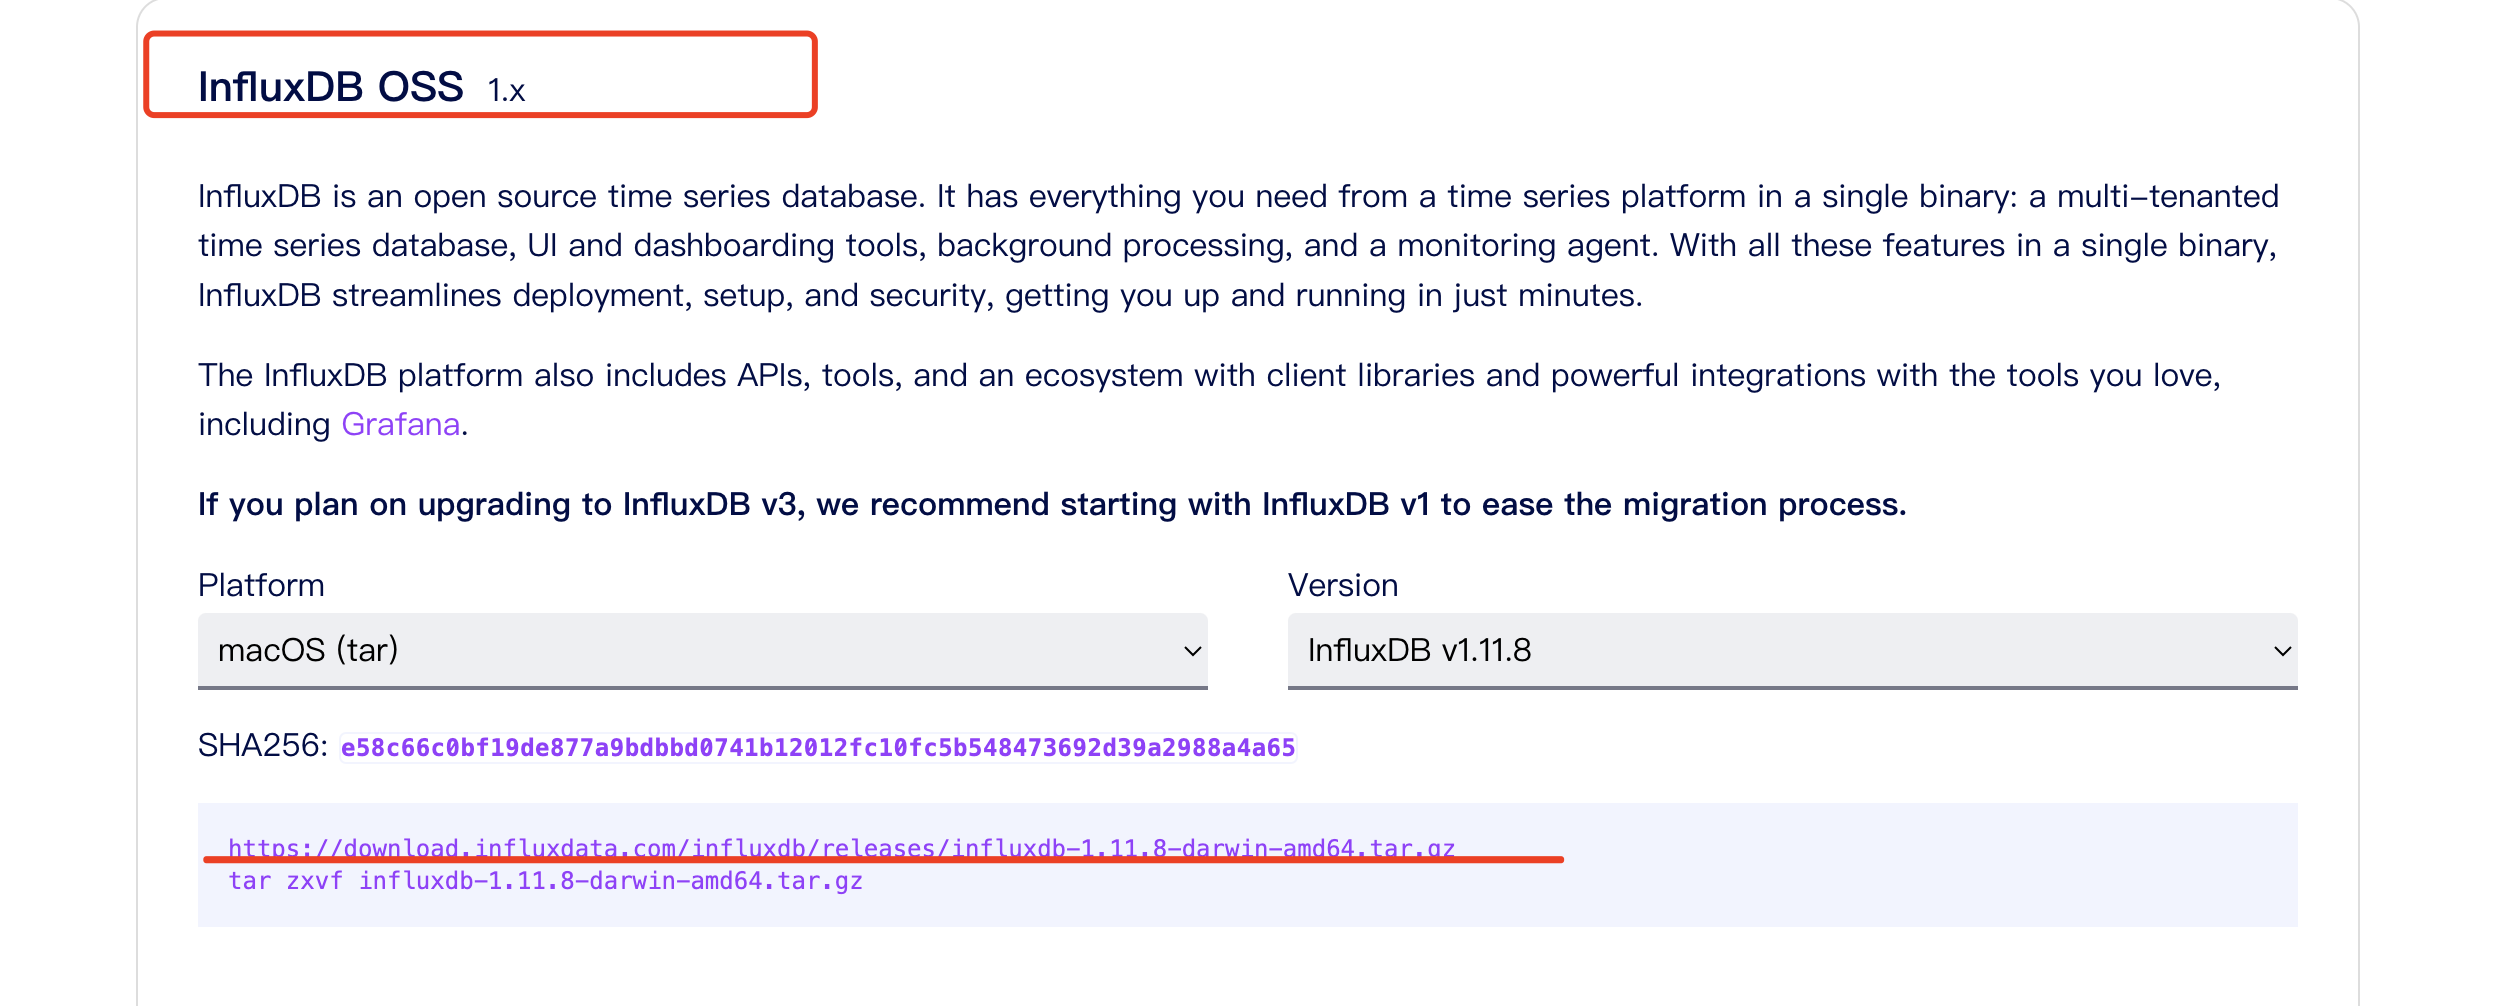
influxd 下載網(wǎng)站:https://www.influxdata.com/downloads/
1、下載:https://download.influxdata.com/influxdb/releases/influxdb-1.11.8-darwin-amd64.tar.gz
2、開(kāi)啟服務(wù):influxd
3、開(kāi)啟客戶(hù)端:influx
4、基本操作
  show databases;
  create database jmeter;
  drop database jmeter;
  use jmeter;
  show measurements;
六、jmeter 連接 influxd
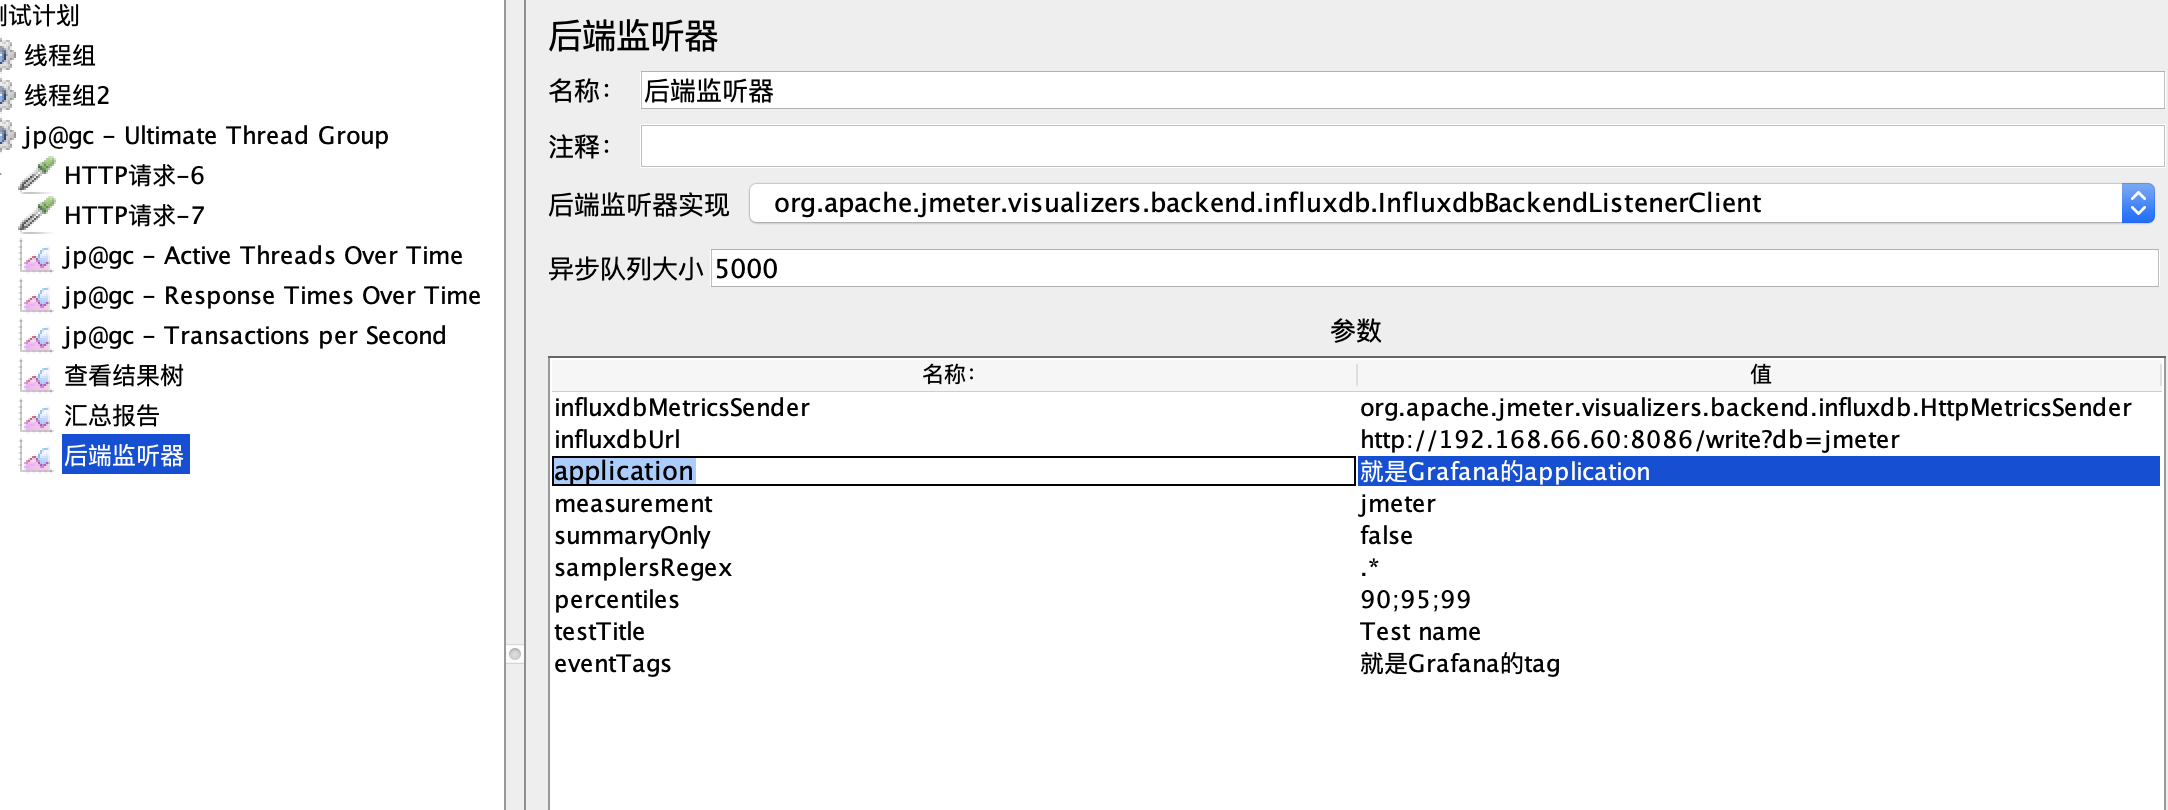
用后端監(jiān)聽(tīng)器配置inlfuxd

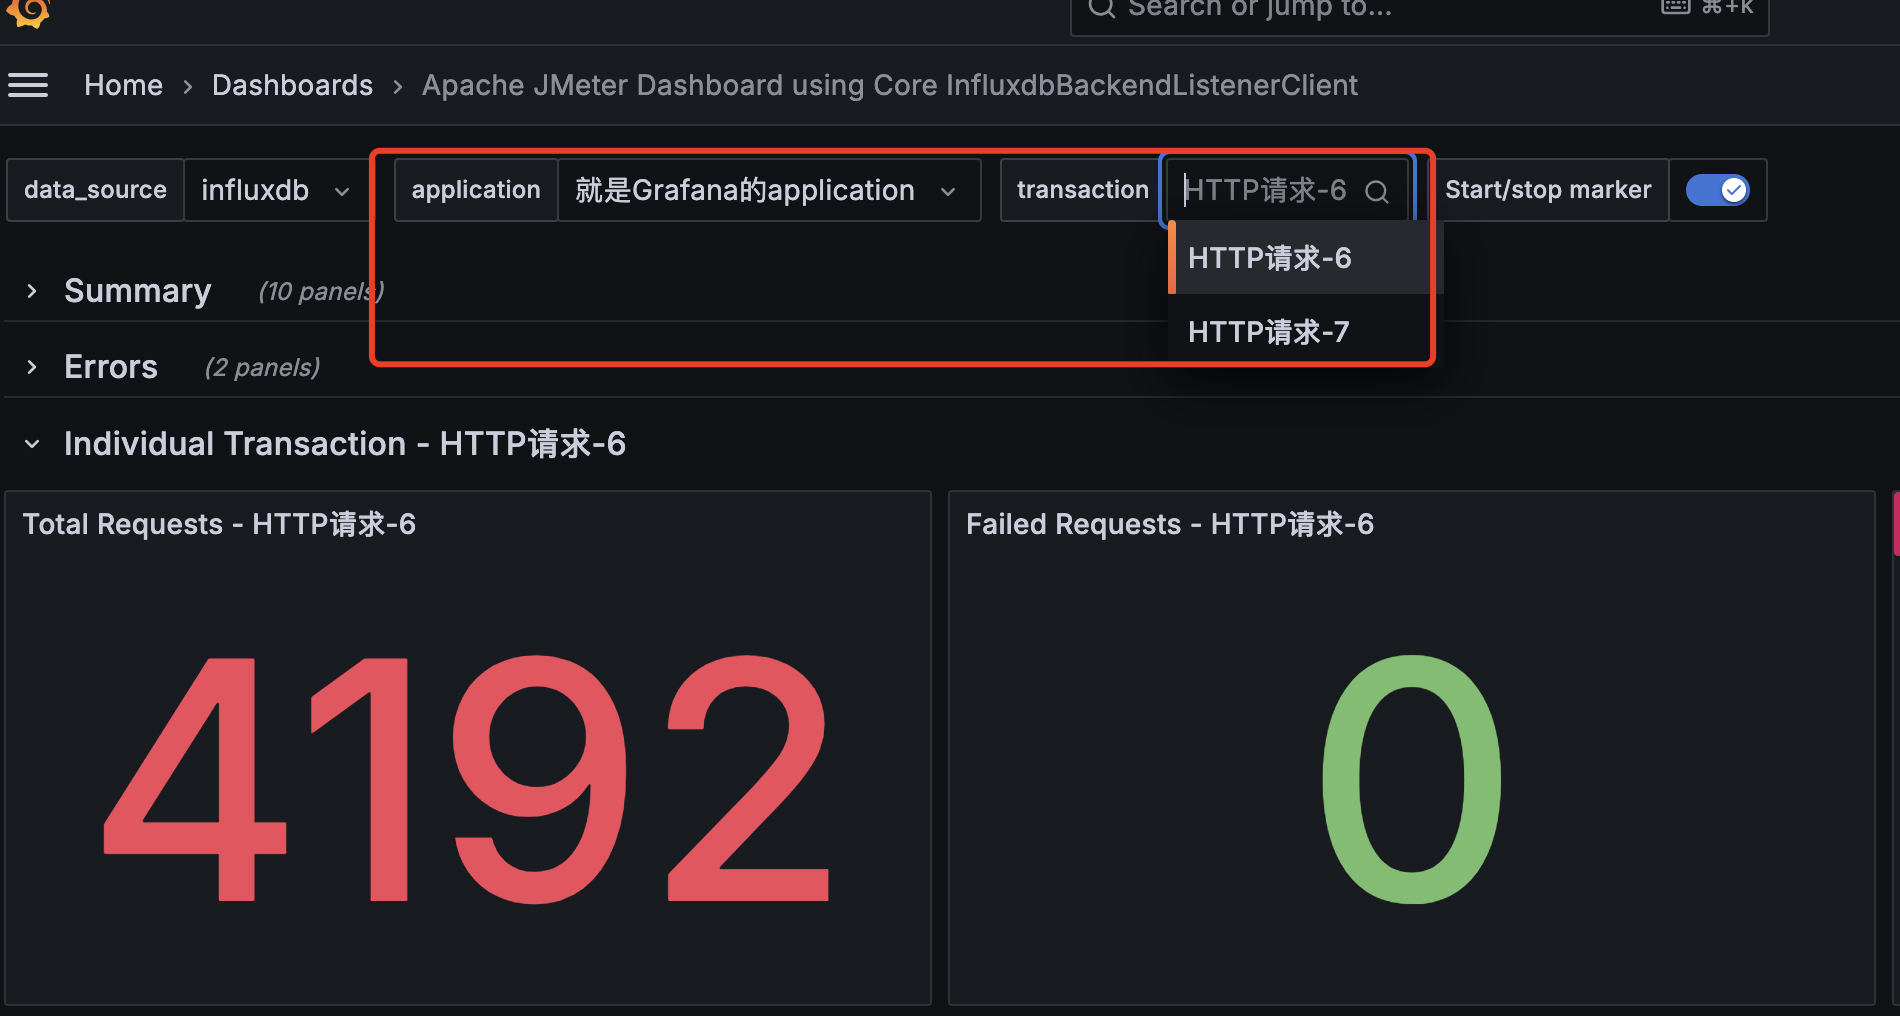
七、Grafana 數(shù)據(jù)可視化
1、Grafana下載鏈接:https://grafana.com/grafana/download?platform=mac
2、啟動(dòng):grafana-server start
3、增加influxdb連接:Home > Connection > Add new connection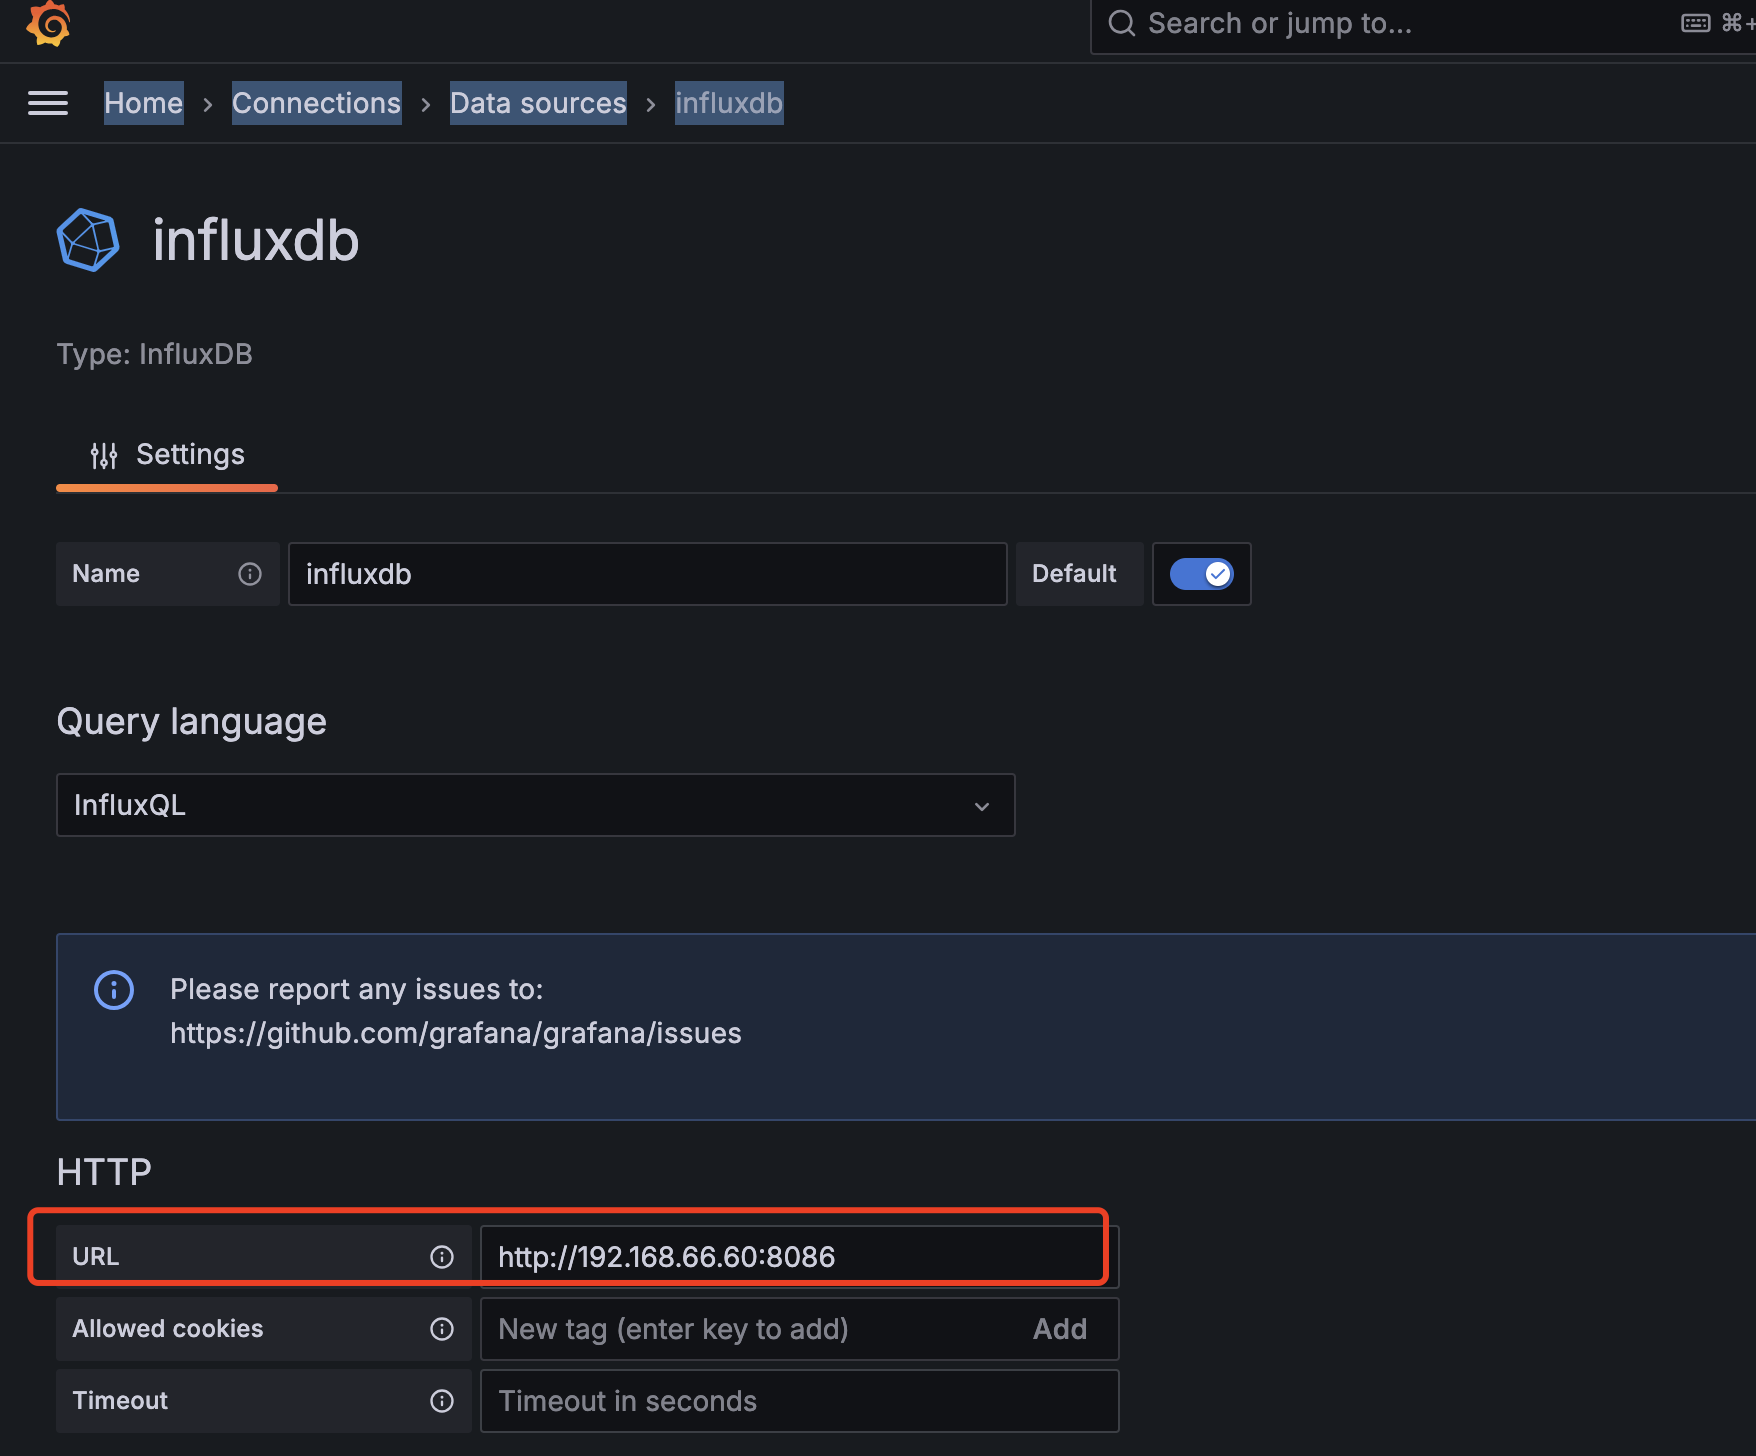

application:就是Grafana的application
measurement:infludb 的表名稱(chēng)
summaryOnly:默認(rèn)為true ,若干個(gè)http 一起統(tǒng)計(jì);false 分開(kāi)統(tǒng)計(jì)
samplersRegex:對(duì)http名稱(chēng)的正則表達(dá)式,默認(rèn)全部
percentiles:統(tǒng)計(jì)90%、95%、99%
testTitle、eventTags:infludb 的表字段

八、Jmeter收集CPU、內(nèi)存、磁盤(pán)
1、下載插件
jp@gc - PerfMon Metrics Collector
2、下載ServerAgent:鏈接: https://pan.baidu.com/s/1v25D67K1M3I7euRDei_-SQ?pwd=pju6 提取碼: pju6
在被測(cè)服務(wù)端啟動(dòng),sh ./startAgent.sh
3、Jmeter 配置


 浙公網(wǎng)安備 33010602011771號(hào)