
prometheus + consul 服務注冊+報警 最佳實踐
一、 說明
本文主要將prometheus和consul 結合起來使用,通過conusl 注冊服務至prometheus,實現服務統一注冊,統一報警管理等。
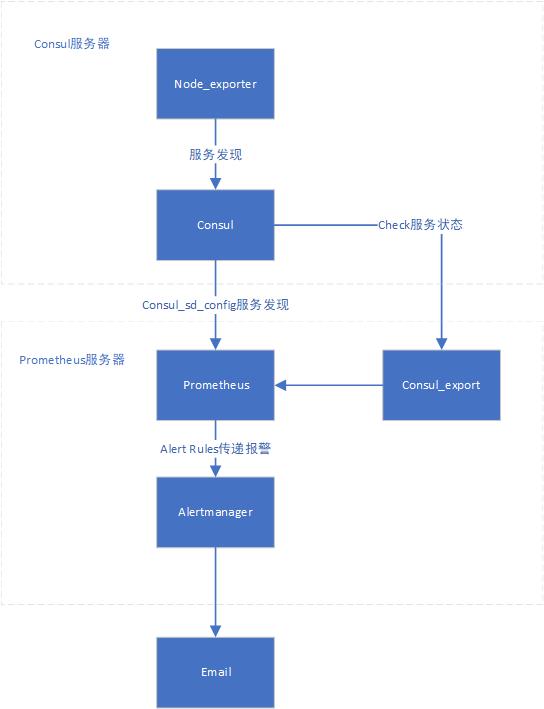
整個架構思路consul+consul_export+prometheus+alertmanager ,consul通過check檢測服務狀態,然后通過consul_export暴露給prometheus,prometheus通過alert規則,通知alertmanager,接著郵件通知管理人員。
在各服務器上安裝node_expoert,然后將node配置到consul的hcl服務文件中,進行服務注冊,當然也可以http api發現。然后在prometheus主yml文件中配置consul_sd_configs對服務進行發現。
單臺架構如下。
本次server服務器有3臺,組建consul集群,全部用做server端,然后在每一臺都部署node_expoerter作為prometheus node節點。
IP規劃如下:
172.19.100.212(prometheus主服務器,理論上可以不部署node_expoerter),
172.19.100.213
172.19.100.52
二、consul集群搭建
2.1 consul安裝
在每臺服務器上安裝consul。采用yum 安裝,這也是我最推薦的方式。配置目錄路徑在/etc/consul.d。
yum install -y yum-utils
yum-config-manager --add-repo https://rpm.releases.hashicorp.com/RHEL/hashicorp.repo
yum -y install consul
2.2 集群文件配置
212服務器的配置如下。data_dir已經在默認的consul.hcl中有配置,所以注釋掉了。其他兩臺服務器根據如下配置分別配置IP。systemct start consul啟動consul即可。
server = true

bootstrap_expect = 3

#        data_dir = "/tmp/consul"

node_name = "172.19.100.212"

bind_addr = "172.19.100.212"

client_addr = "0.0.0.0"

ui_config = {

  enabled = true

}

enable_script_checks = true

start_join = [

  "172.19.100.213",

  "172.19.100.52"

]

retry_join = [

  "172.19.100.213",

  "172.19.100.52"

]

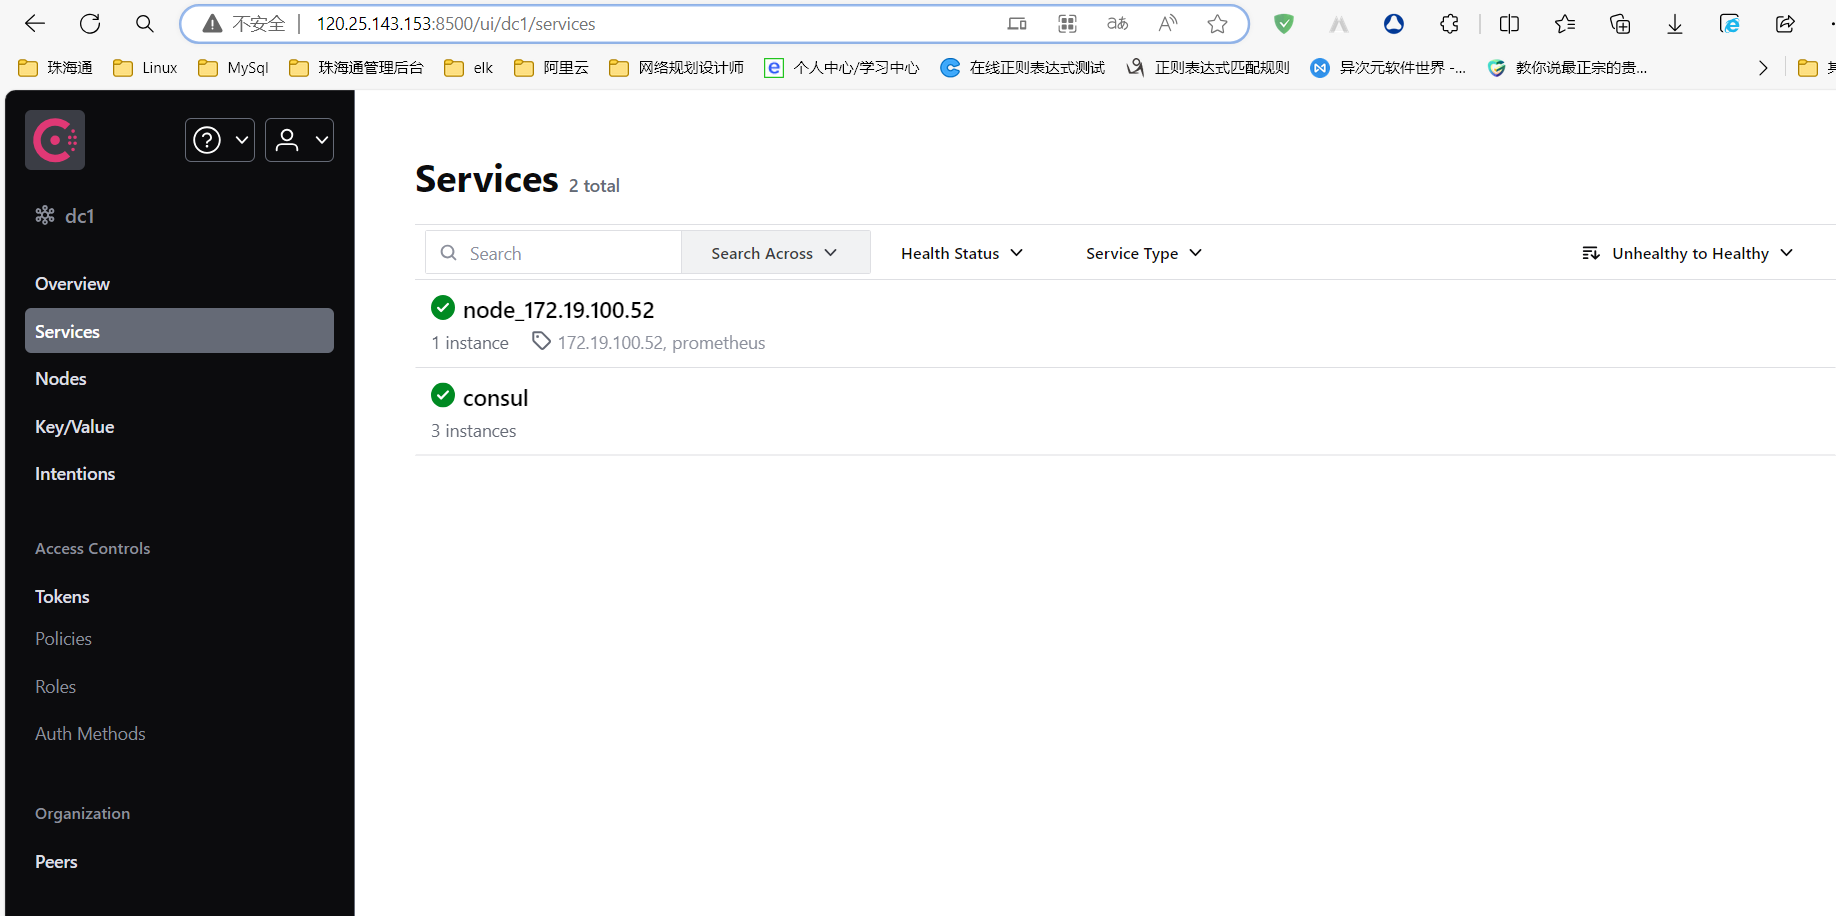
搭建好的集群如下:
2.3 consul_exporter安裝
consul_exporter主要用于將consul的check 報警導出到prometheus ,這樣在prometheus就不需要再次配置報警規則了。
下載地址:https://github.com/prometheus/consul_exporter/releases
當然如果需要額外的報警功能,可以通過blackbox_exporter配置,里邊有很多報警模塊。
consul_export 不需要額外的配置,三臺直接安裝后啟動即可,后續在prometheus中配置三臺的地址即可。目前我只在212服務器上安裝了。
[root@zht-app001 opt]# tar -xzvf consul_exporter-0.11.0.linux-amd64.tar.gz

consul_exporter-0.11.0.linux-amd64/

consul_exporter-0.11.0.linux-amd64/LICENSE

consul_exporter-0.11.0.linux-amd64/consul_exporter

consul_exporter-0.11.0.linux-amd64/NOTICE

[root@zht-app001 opt]# cd consul_exporter-0.11.0.linux-amd64

[root@zht-app001 consul_exporter-0.11.0.linux-amd64]# ls

consul_exporter  LICENSE  NOTICE

[root@zht-app001 consul_exporter-0.11.0.linux-amd64]# nohup ./consul_exporter &

[1] 11749

[root@zht-app001 consul_exporter-0.11.0.linux-amd64]# nohup: ignoring input and appending output to ‘nohup.out’

[root@zht-app001 consul_exporter-0.11.0.linux-amd64]# tail -f nohup.out

ts=2024-03-18T02:07:50.153Z caller=consul_exporter.go:82 level=info msg="Starting consul_exporter" version="(version=0.11.0, branch=HEAD, revision=3e5be6411ce11ba011b9e4fe52029daba8160ee8)"

ts=2024-03-18T02:07:50.153Z caller=consul_exporter.go:83 level=info build_context="(go=go1.21.5, platform=linux/amd64, user=root@34d50aaee2f8, date=20231225-15:29:52, tags=unknown)"

ts=2024-03-18T02:07:50.154Z caller=tls_config.go:274 level=info msg="Listening on" address=[::]:9107

ts=2024-03-18T02:07:50.154Z caller=tls_config.go:277 level=info msg="TLS is disabled." http2=false address=[::]:9107
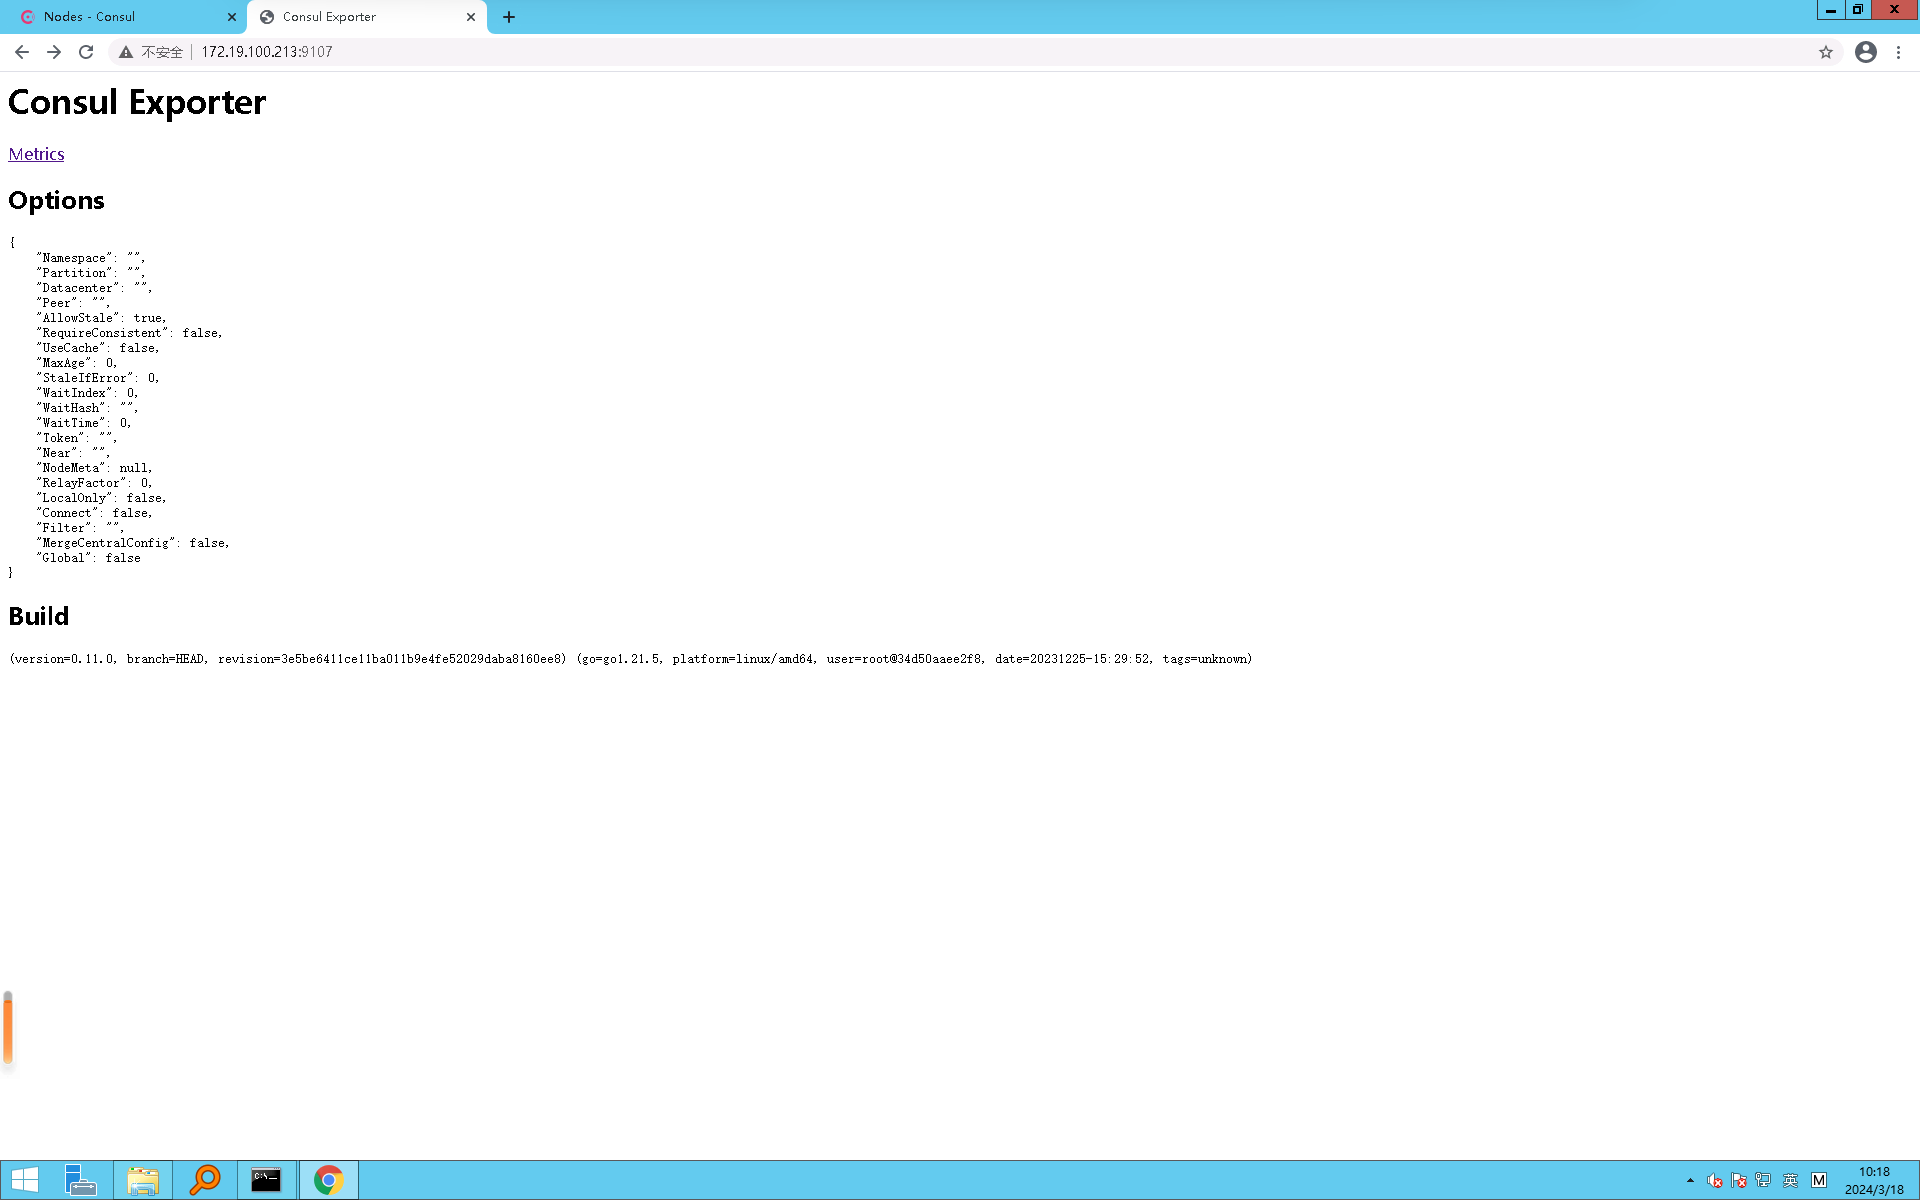
consul_exporter的可選配置如下,如果不配置都是默認的,consul的token我將在最后配置。配置命令如下:
export CONSUL_HTTP_TOKEN=<your_token_here>
2.4 consul token設置
三、prometheus 搭建
前往https://prometheus.io/download/ 下載最新的prometheus組件
3.1 node_exporter 安裝 和注冊
每一個conul (server/client)agent上都需要安裝node_exporter,然后分別對node進行注冊。
3.1.1 安裝
我將文件下載到了/opt目錄,然后將node_exporter配置為系統service;文件名為node_exporter.service,放置在/etc/systemd/system目錄下:
配置如下:
[Unit]

Description=Node Exporter for Prometheus

After=network-online.target


[Service]

#User=<非特權用戶,例如 node_exporter>

ExecStart=/opt/node_exporter-1.7.0.linux-amd64/node_exporter

#EnvironmentFile=-/etc/default/node_exporter  # 如果有額外環境變量配置,可以在這里引用

Restart=on-failure

RestartSec=5s


[Install]

WantedBy=multi-user.target
操作命令如下
systemctl daemon-reload

systemctl start node_exporter.service

systemctl status node_exporter.service

systemctl enable node_exporter.service
狀態如下

3.1.2 注冊到consul
在consul配置文件夾下新建hcl文件即可,配置如下,其余服務器按照一樣的操作進行。
[root@izwz92l6wmcnfyprbcxmjkz opt]# cd /etc/consul.d/

[root@izwz92l6wmcnfyprbcxmjkz consul.d]# ls

consul.env  consul.hcl  server.hcl

[root@izwz92l6wmcnfyprbcxmjkz consul.d]# vim node_exporter.hcl
Token在后續配置,配置好后,重新啟動consul
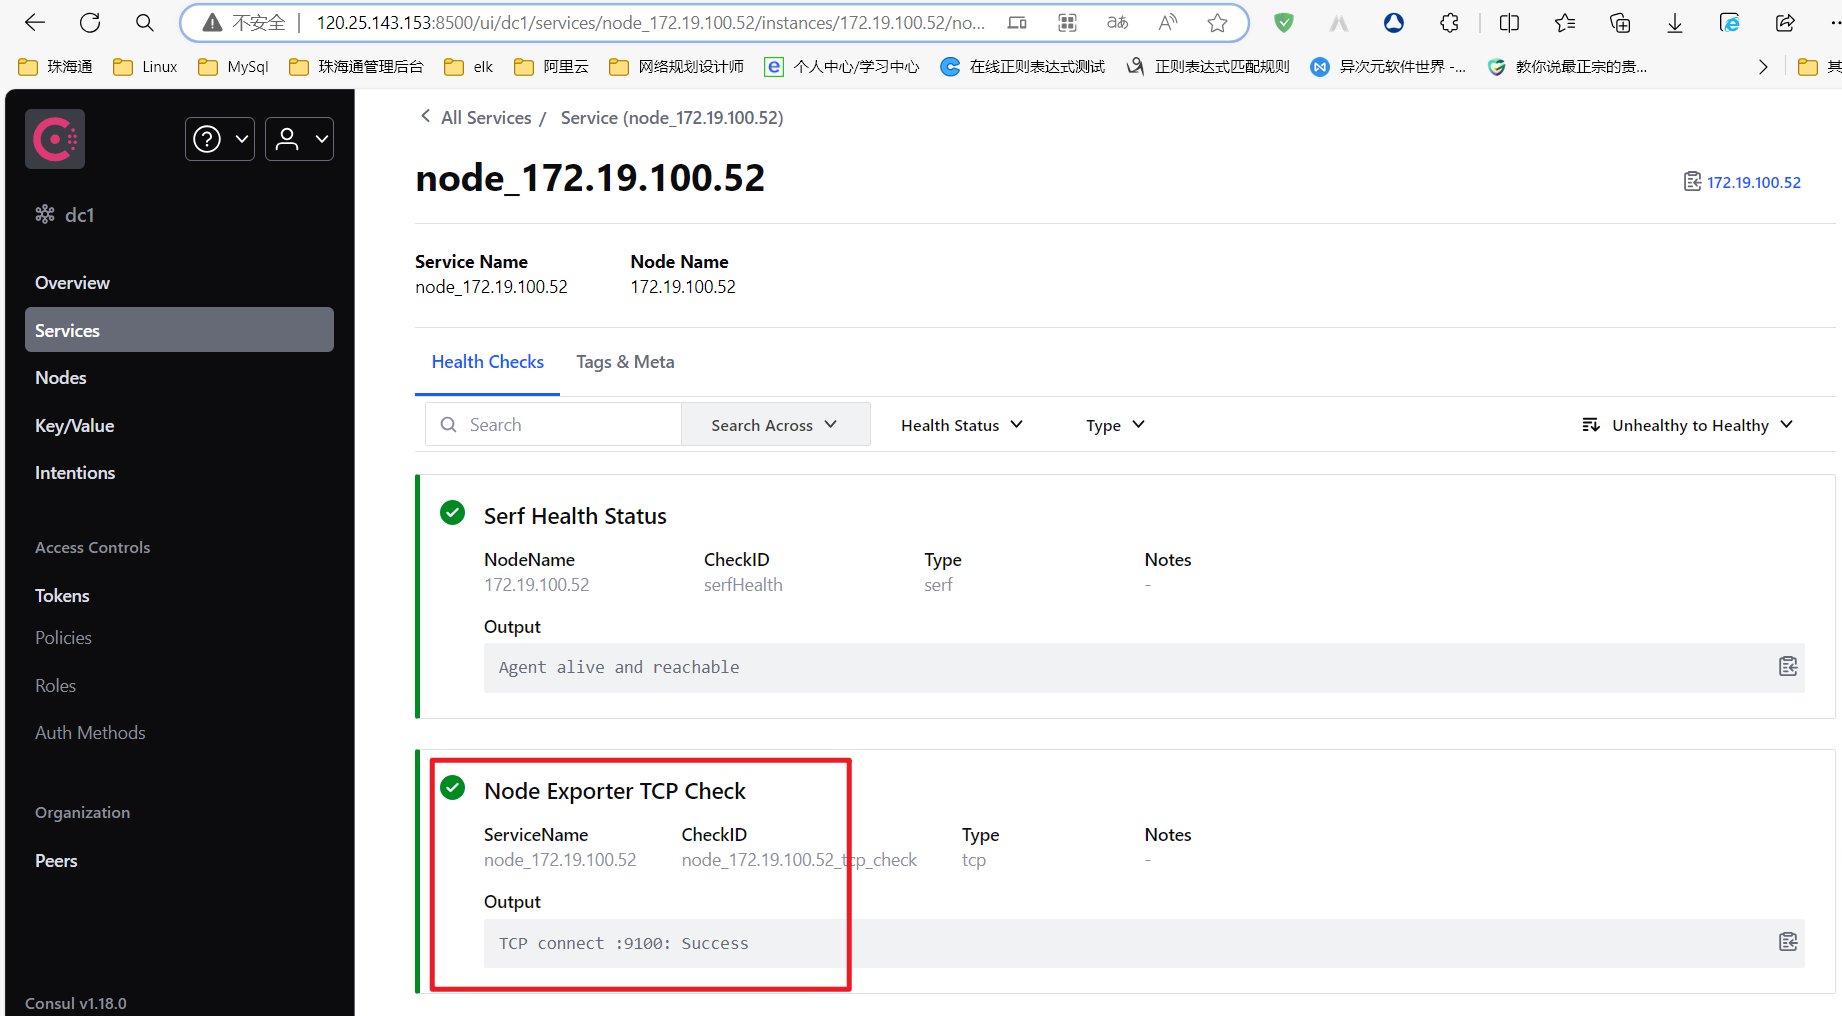
services {

  name = "node_172.19.100.52"

  address = "172.19.100.52"

  id = "node_172.19.100.52"

  port = 9100

  tags = ["prometheus","172.19.100.52"]

  #token = "d1e6d941-8577-1f27-dd7b-0d8ac9212ba5"

  checks {

    id = "node_172.19.100.52_tcp_check"

    name = "Node Exporter TCP Check"

    interval = "10s"

    timeout = "1s"

    tcp = ":9100"

  }

}
可以看到node注冊成功,check檢查成功,這個結果后續我們要通過consul_exporter傳到至prometheus。
3.2 安裝prometheus
將下載的tar.gz解下后,將prometheus配置成系統/etc/systemd/system/prometheus.service
[Unit]

Description=Prometheus Monitoring System

Documentation=https://prometheus.io/docs/introduction/overview/

After=network-online.target


[Service]

#User=prometheus

#Group=prometheus

ExecStart=/opt/prometheus-2.50.1.linux-amd64/prometheus  --config.file=/opt/prometheus-2.50.1.linux-amd64/prometheus.yml

Restart=always

RestartSec=10s

LimitNOFILE=4096


[Install]

WantedBy=multi-user.target
sudo systemctl daemon-reload

sudo systemctl start prometheus

sudo systemctl status prometheus # 查看服務運行狀態

sudo systemctl enable prometheus # 設置開機啟動
3.3 配置consul_sd_config 和consul_exporter
在prometheus.yml配置如下,然后重啟prometheus 即可
- job_name: "consul_export報警"

    static_configs:

      - targets: ["172.19.100.212:9107"] # 這里填寫 Consul Exporter 監聽的 IP 和端口

    relabel_configs: [] # 根據需要重寫標簽


  - job_name: "node_export服務發現"

    consul_sd_configs:

      - server: "172.16.100.212:8500"

        #token: "4489cdd3-1952-4ded-4eb9-07a823f5b2ff"

        #token: "3ce3c959-c9e5-7e2c-abe7-1fccbbfe01ae"

        tags:

          - "prometheus"

    relabel_configs:

      - source_labels: [__meta_consul_health]

        target_label: service_health_status
界面如圖
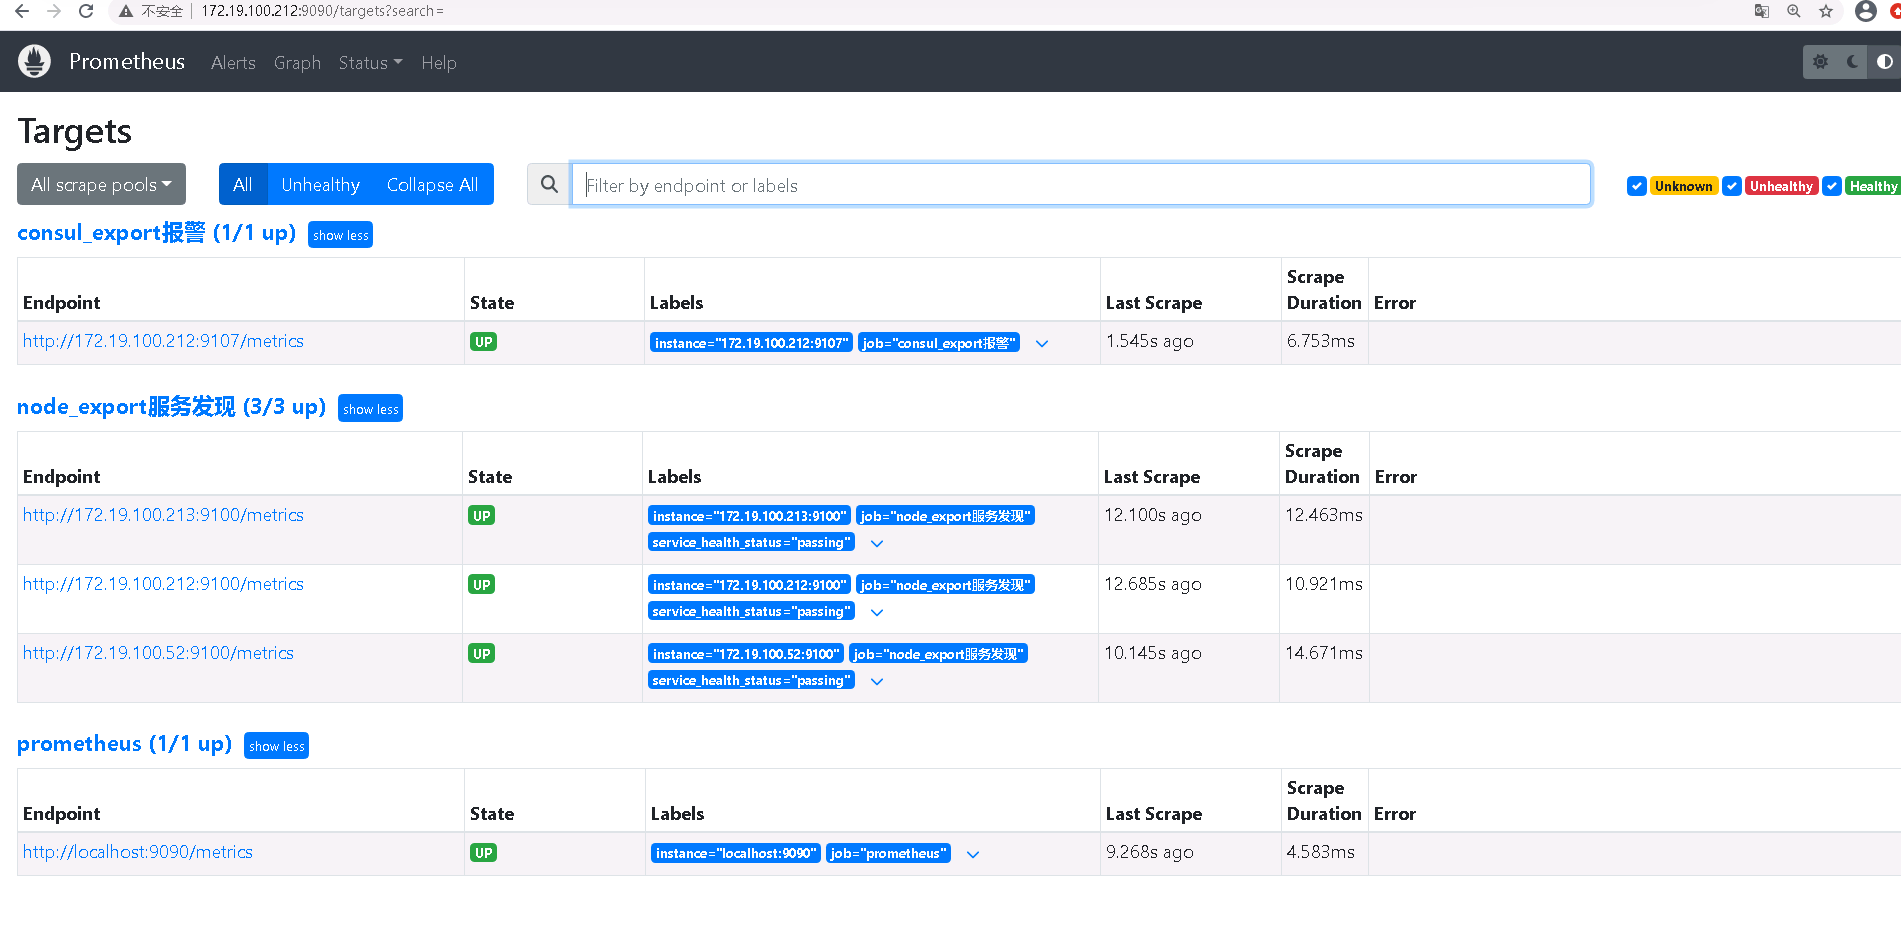
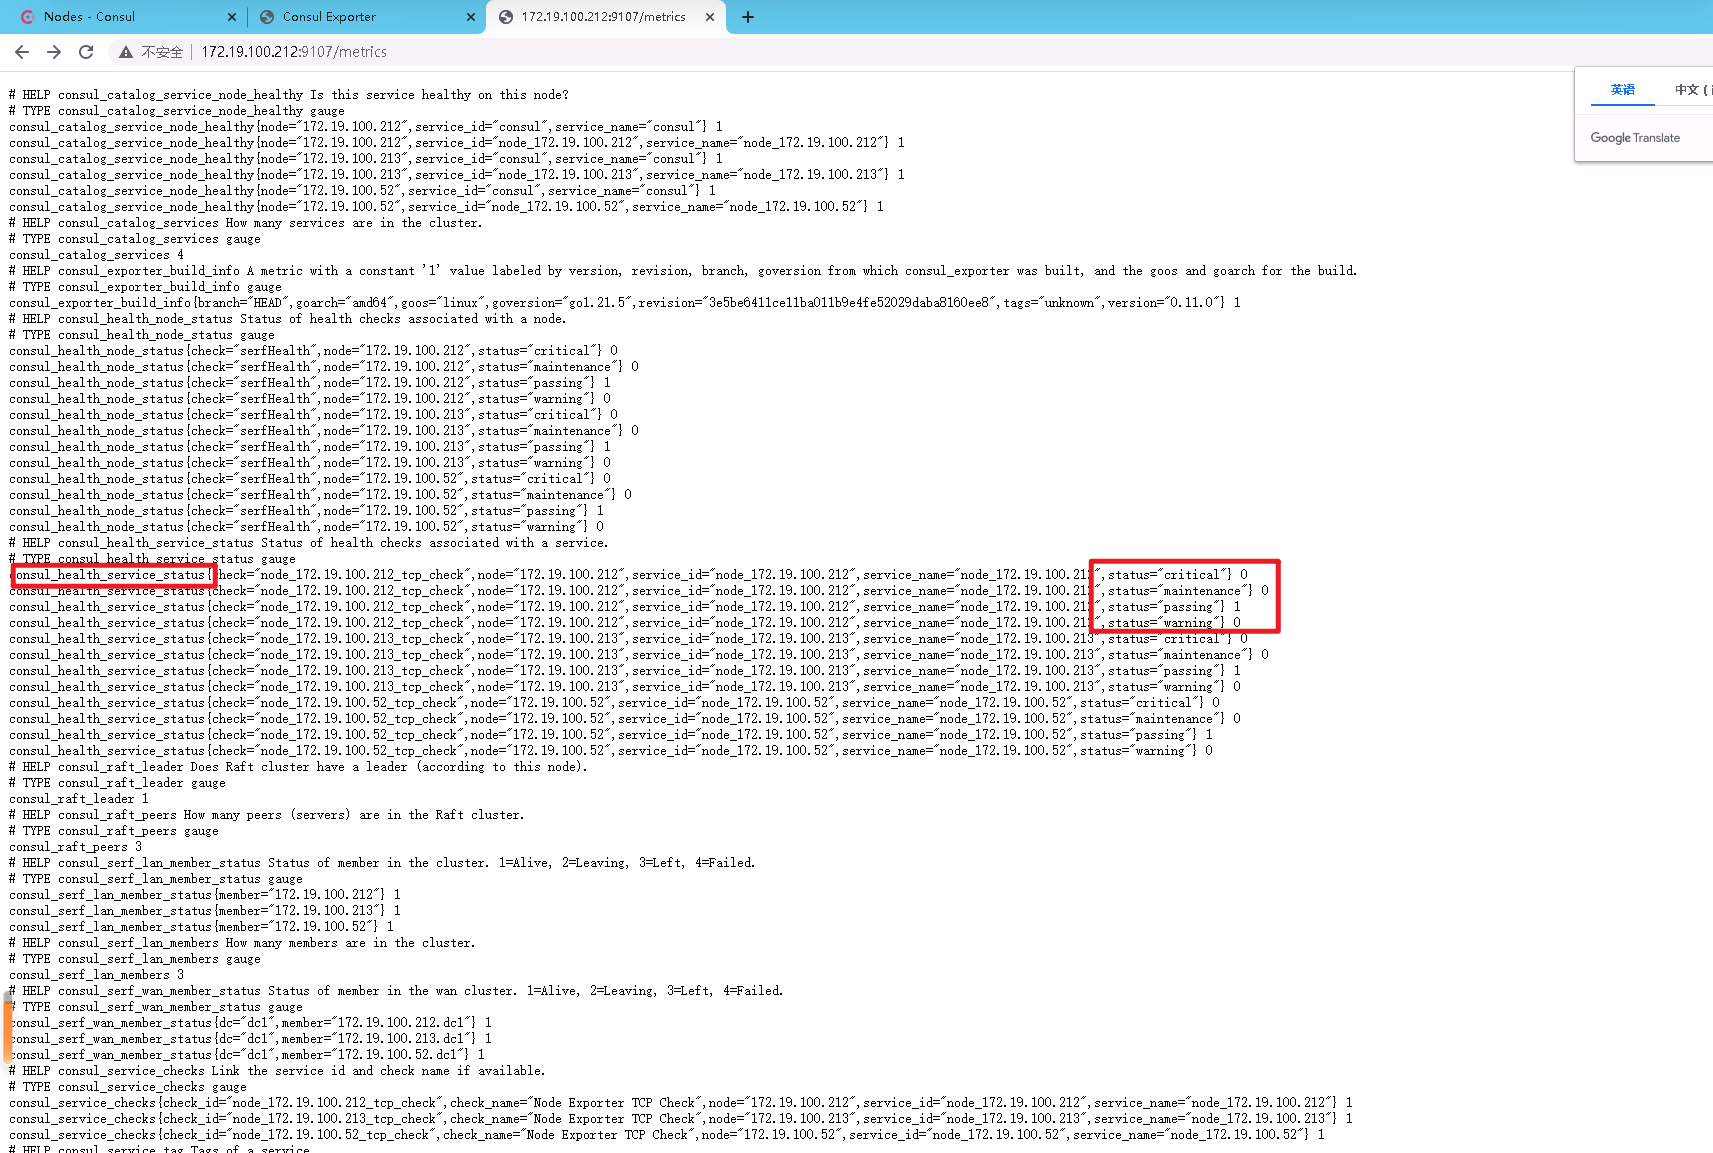
點擊consul_exporter報警的endpoint的的界面如下,可以看到服務的check狀態。我們可以根據這些狀態編寫rules進行報警。
3.4 rules 報警規則配置
需要先在prometheus.yml中加如下配置
rule_files:

  # - "first_rules.yml"

  # - "second_rules.yml"

  - "prometheus.rules.yml"
在prometheus.rules.yml配置如下,這是針對3.3中node的報警規則,一旦有匹配的expr,則會觸發rules中的alert規則。而alert規則會直接傳送到alertmanager里邊查看默認的route,再決定下一步操作(比如發送郵件報警,或者發送到企業微信)。
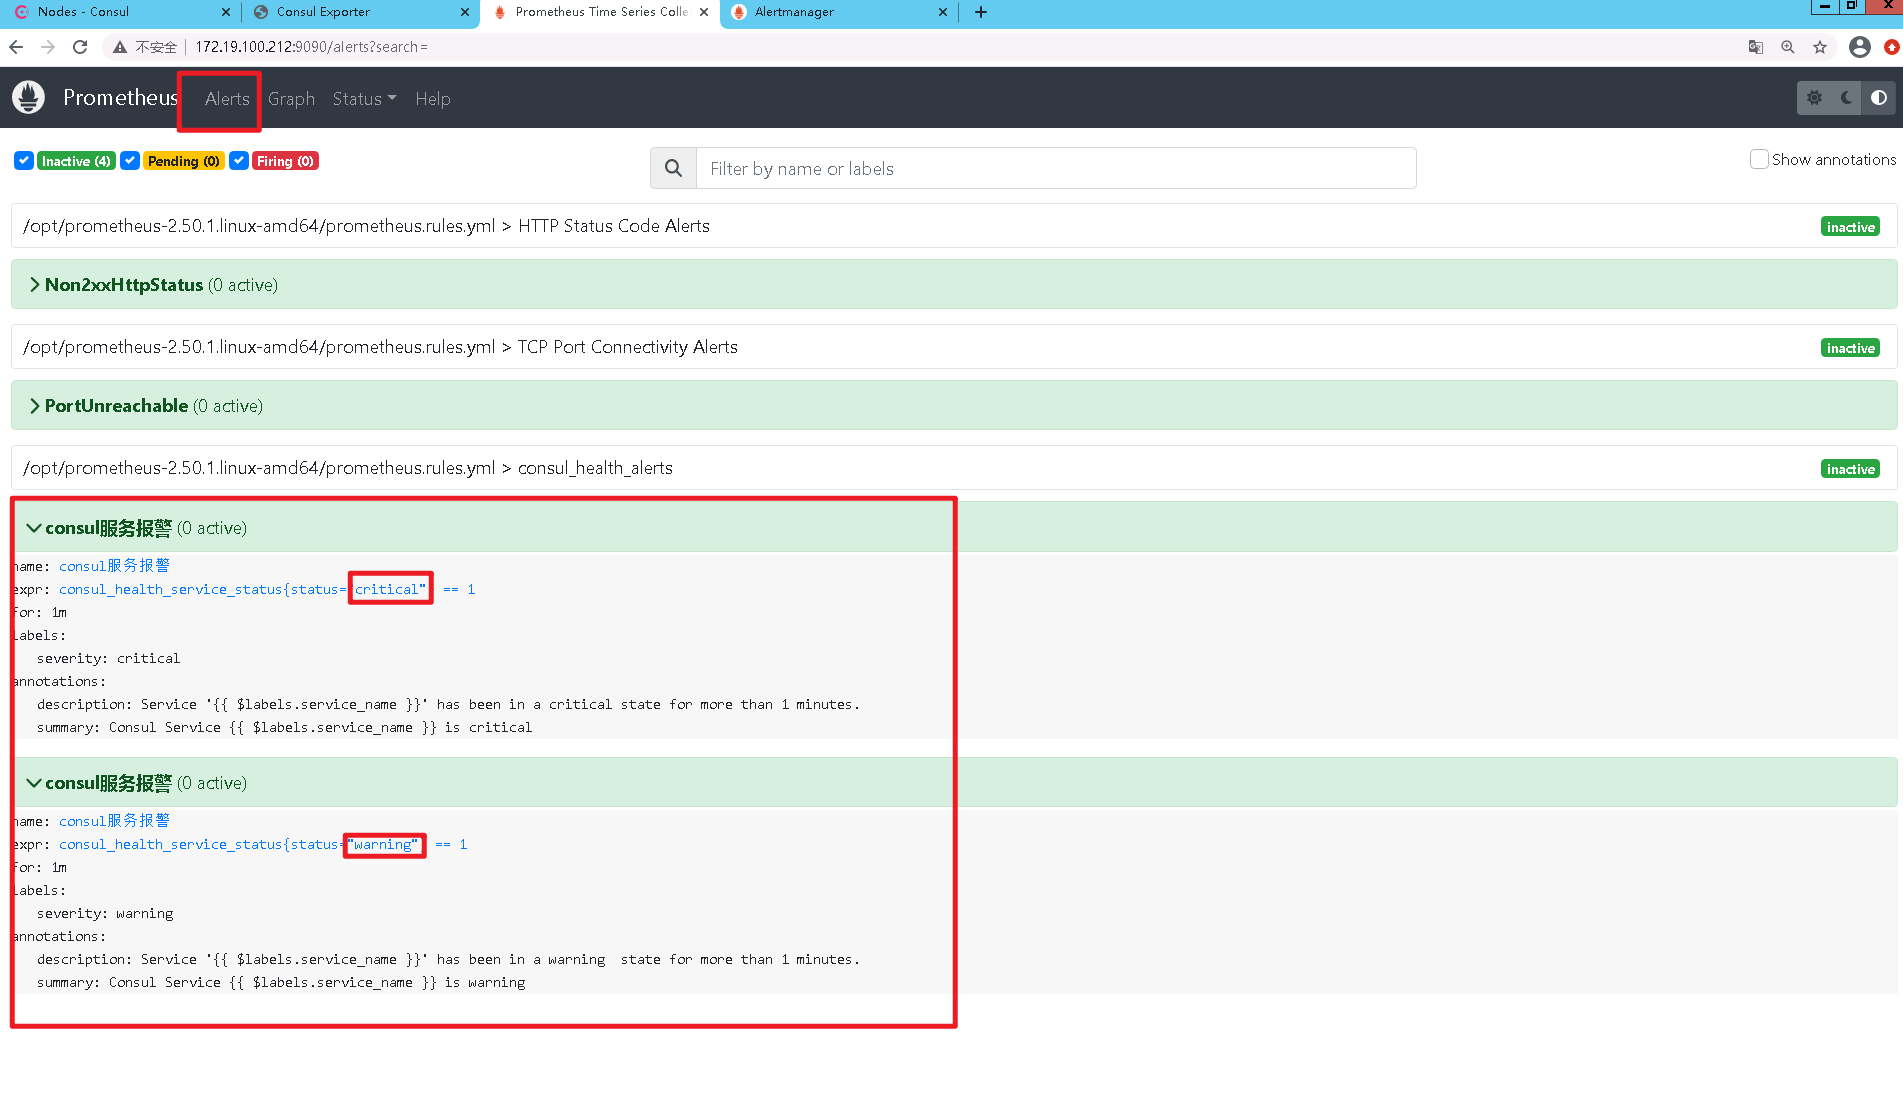
groups:

#consu_export報警

- name: consul_health_alerts

  rules:

    - alert: "consul服務報警"

      expr: consul_health_service_status{status="critical"} == 1 # 1 表示critical狀態

      for: 1m # 可以根據實際情況調整這個時間窗口,比如持續5分鐘未恢復才報警

      labels:

        severity: critical

      annotations:

        summary: "Consul Service {{ $labels.service_name }} is critical"

        description: "Service '{{ $labels.service_name }}' has been in a critical state for more than 1 minutes."

    - alert: "consul服務報警"

      expr: consul_health_service_status{status="warning"} == 1

      for: 1m # 可以根據實際情況調整這個時間窗口,比如持續5分鐘未恢復才報警

      labels:

        severity: warning

      annotations:

        summary: "Consul Service {{ $labels.service_name }} is warning"

        description: "Service '{{ $labels.service_name }}' has been in

a warning  state for more than 1 minutes."
這是prometheus的alert頁面,顯示的就是我上邊配置的報警規則
3.5 alertmanager 配置
需要現在prometheus.yml中加入以下配置
# Alertmanager configuration

alerting:

  alertmanagers:

    - static_configs:

        - targets:

            - localhost:9093
將tar.gz解壓到/opt/,然后配置系統服務/etc/systemd/system/ alertmanager.service
[Unit]

Description=Prometheus Alertmanager System

After=network-online.target


[Service]

ExecStart=/opt/alertmanager-0.27.0.linux-amd64/alertmanager  --config.file=/opt/alertmanager-0.27.0.linux-amd64/alertmanager.yml

Restart=on-failure

RestartSec=5s


[Install]

WantedBy=multi-user.target
systemctl daemon-reload

systemctl start alertmanager.service

systemctl status alertmanager.service

systemctl enable alertmanager.service
alertmanager.yml配置如下,我通過QQ郵件進行報警。
global:

  resolve_timeout: 5m


route:

  receiver: "email-receiver"


receivers:

  - name: "email-receiver"

    email_configs:

      - send_resolved: true # 是否發送解決通知

        to: "XXXXX" # 接收報警郵件的地址

        from: "XXXXX " # 發送報警郵件的地址

        smarthost: "smtp.qq.com:587" # SMTP服務器地址及端口

        auth_username: "XXXXX" # SMTP用戶名

        auth_password: "XXXXX" # SMTP密碼(如果是明文,推薦使用加密存儲)

        require_tls: true # 如果SMTP服務器支持TLS,則啟用


inhibit_rules: [] # 可選,抑制規則配置
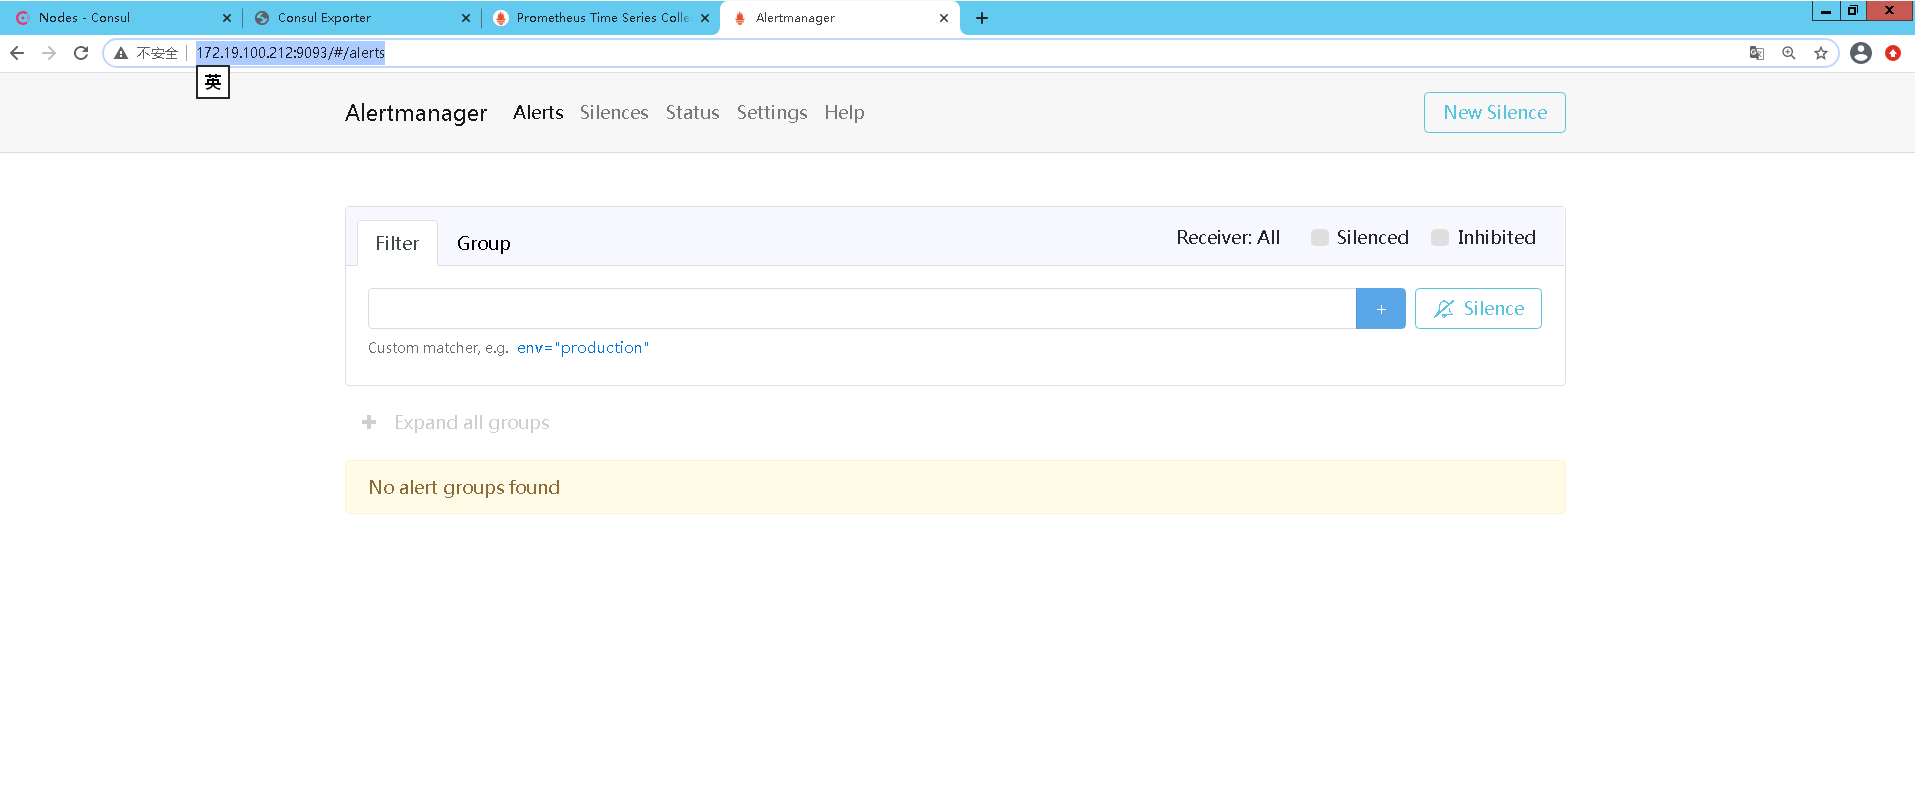
這是alertmanager頁面,目前還沒有報警,所以是空白的,下邊我們來將其中一個node_export節點停掉,來觀察一下報警。
3.6 報警演示
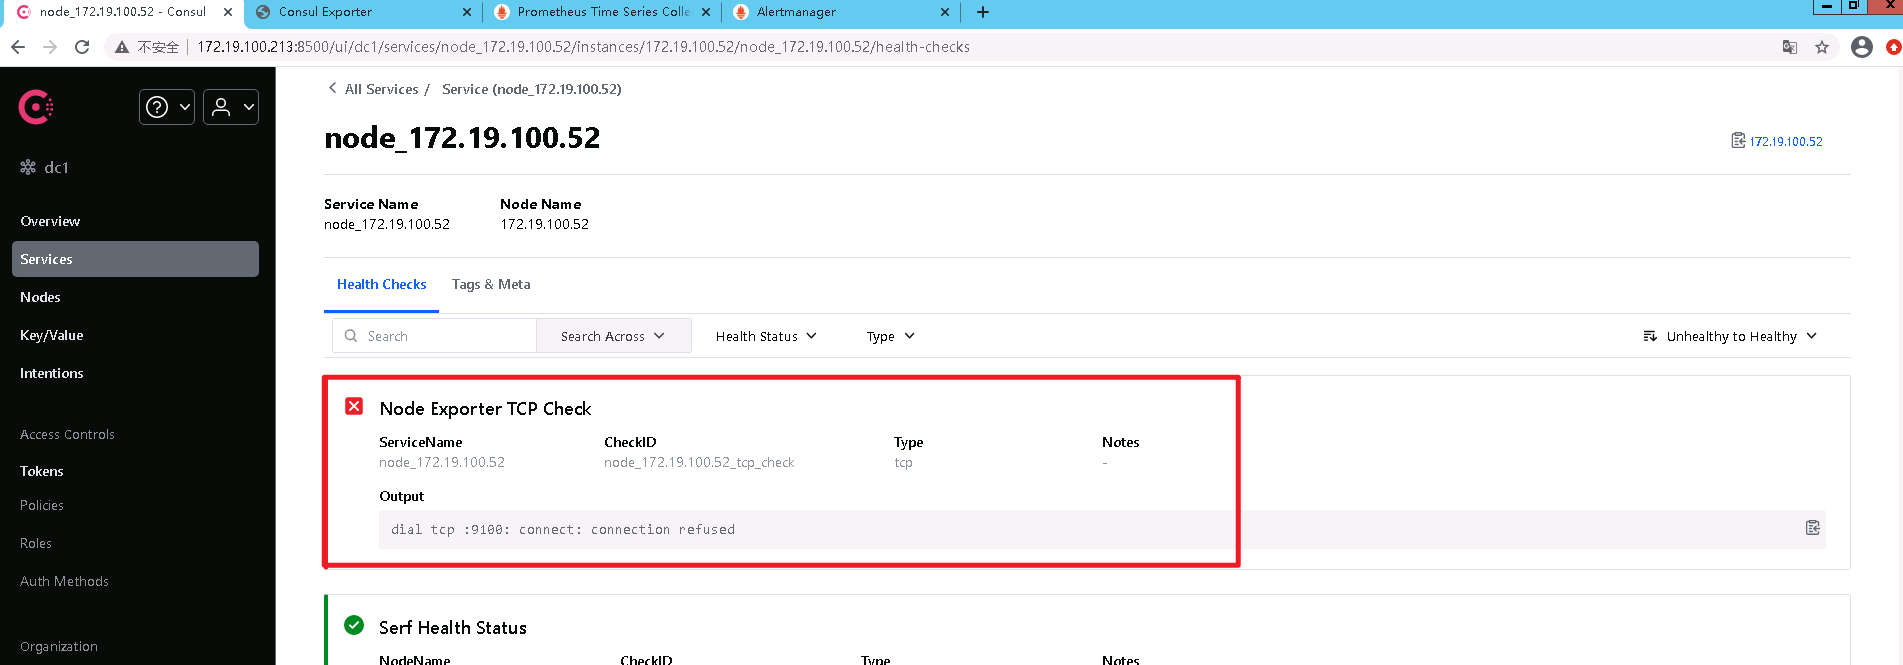
手動關閉52服務器上的node_exporter 服務 Systemctl stop node_exporter
1、consul最先check出報警
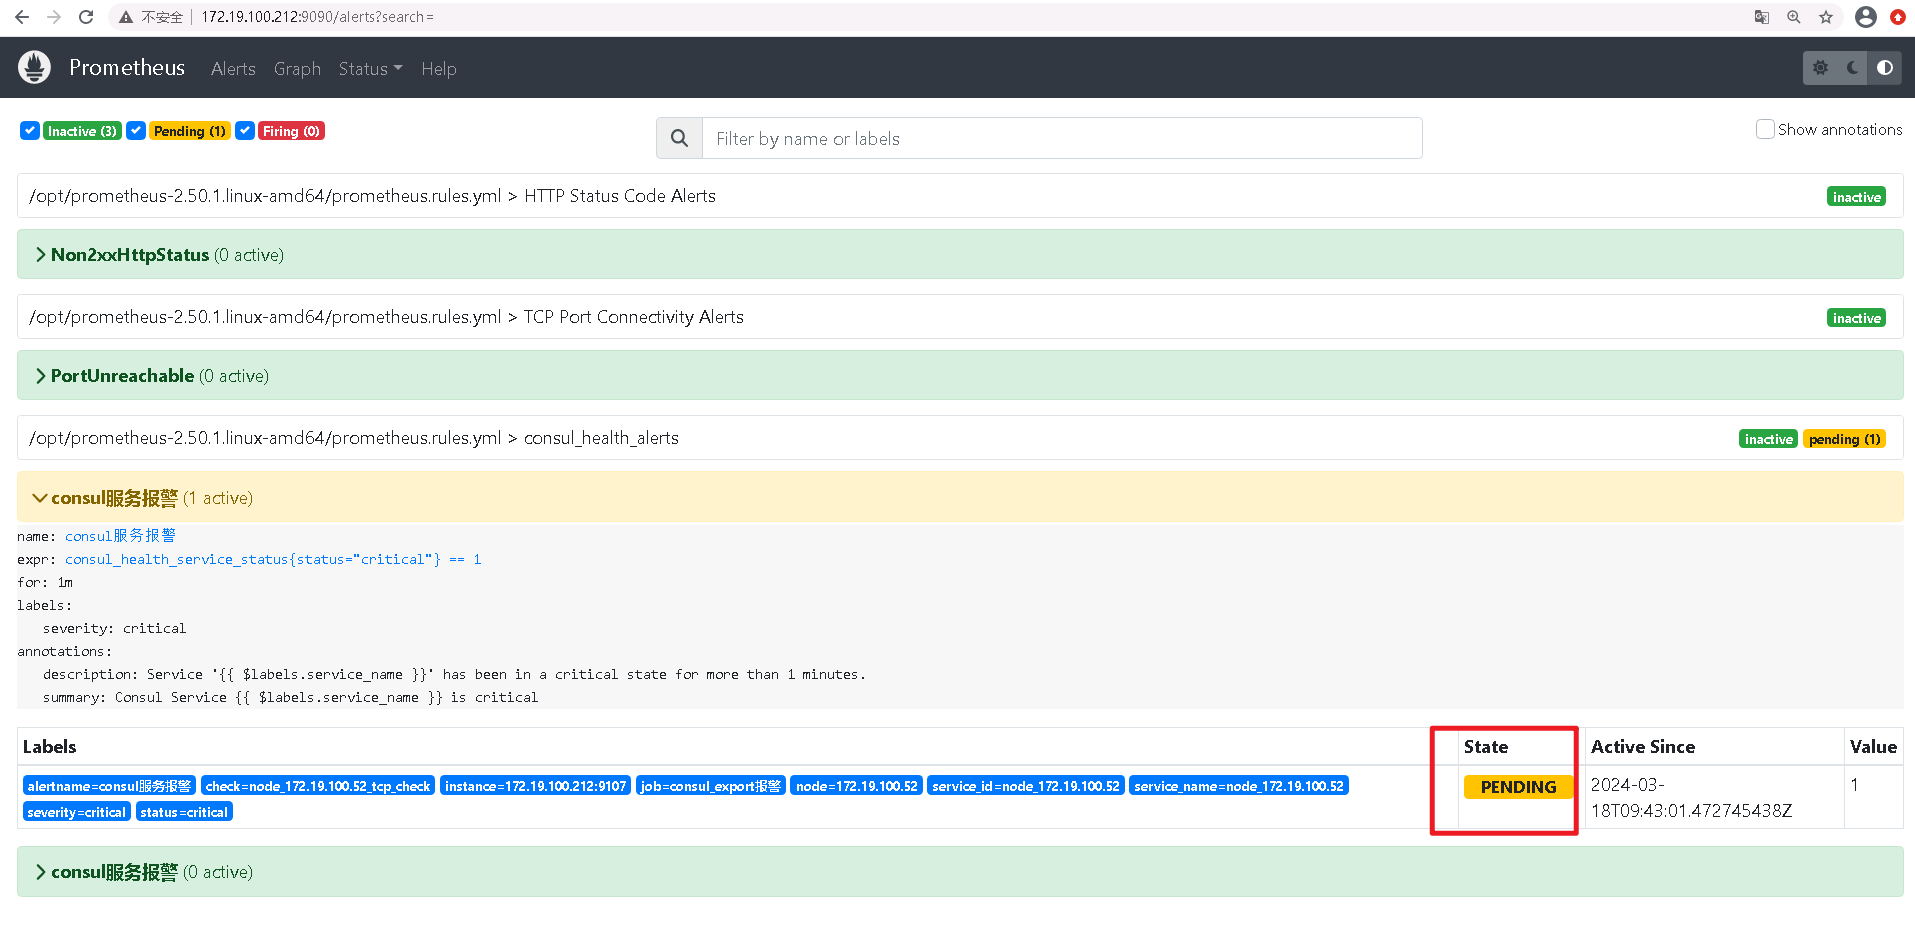
2、prometheus alert進入pending狀態
如果1分鐘內,狀態沒有改變,則變為firing
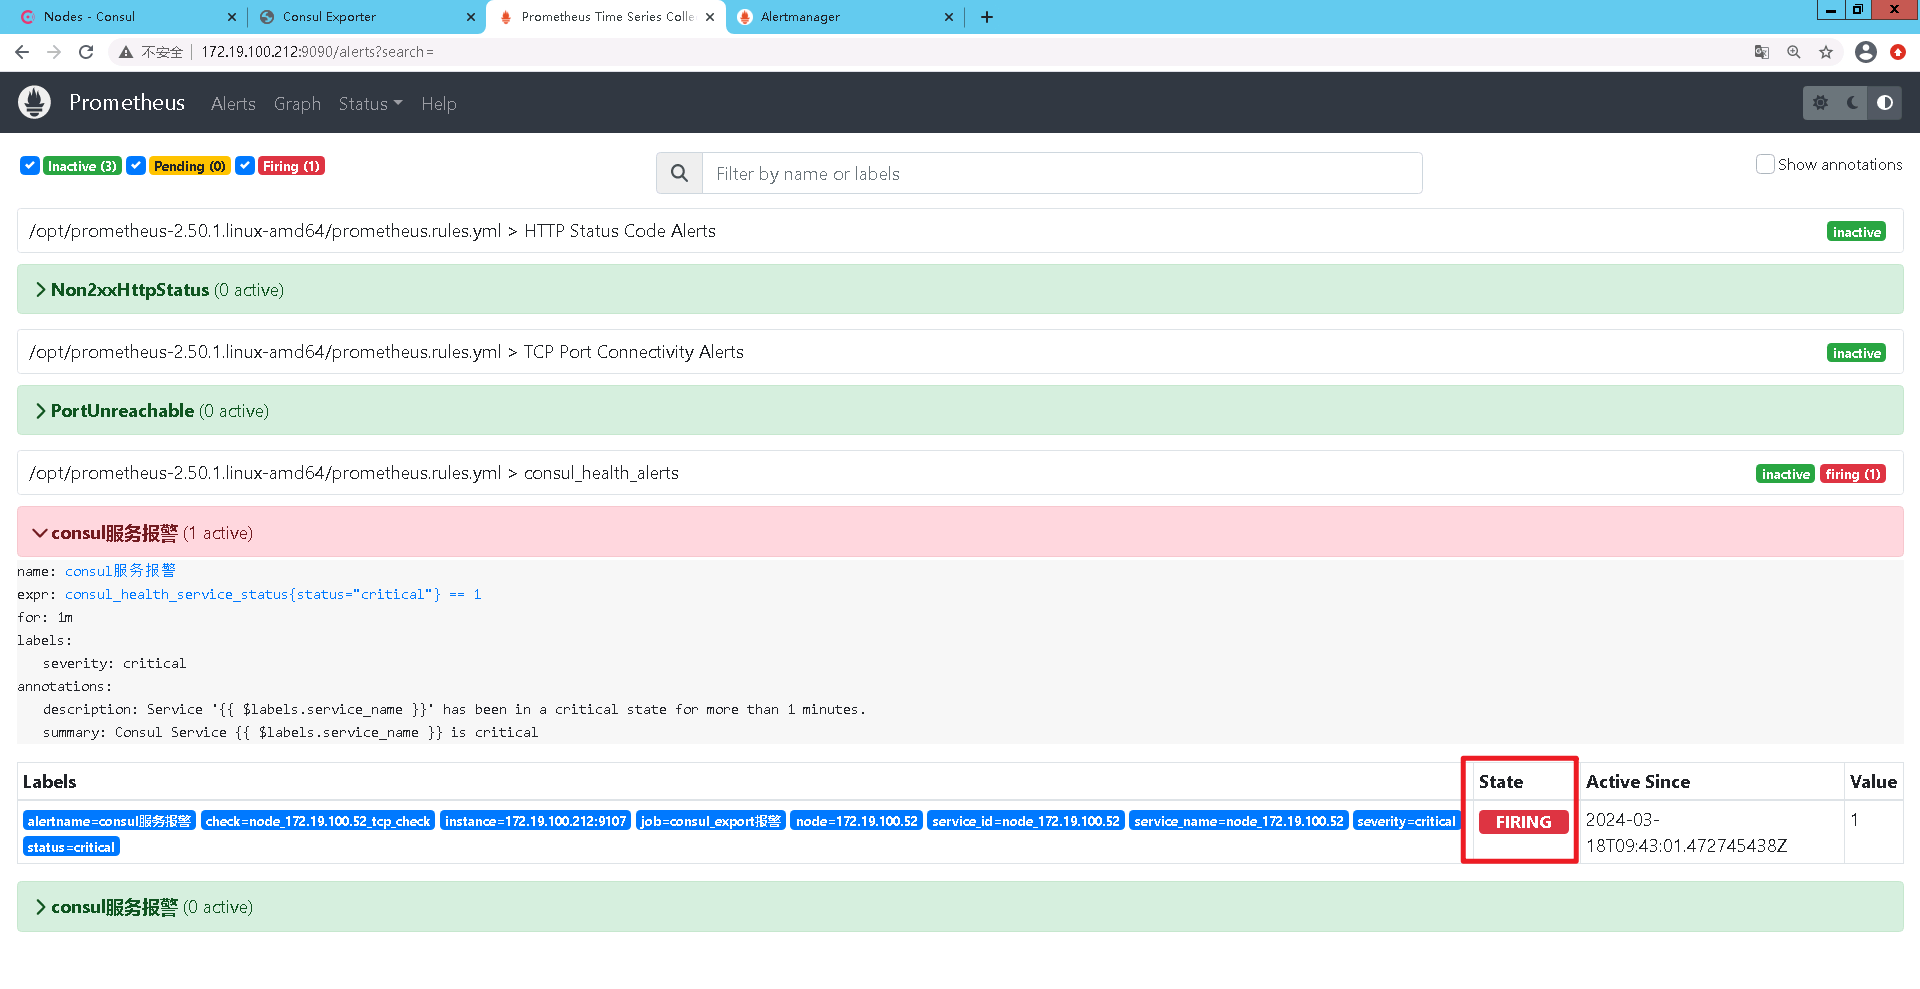
3、prometheus alert進入firing狀態
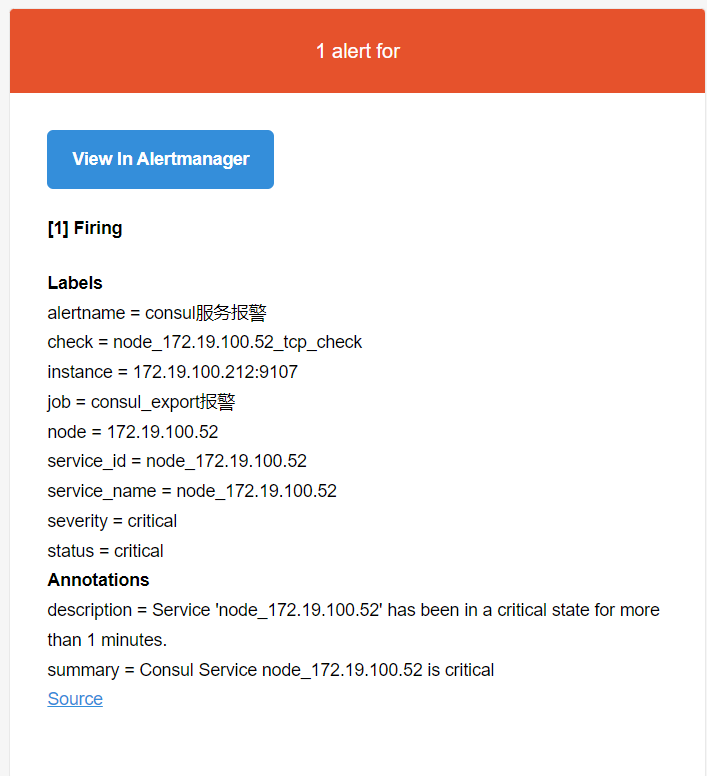
4、alertmanager平臺觸發報警
將通過alertmanager.yml中route規則發送郵件。

5、接收到報警郵件
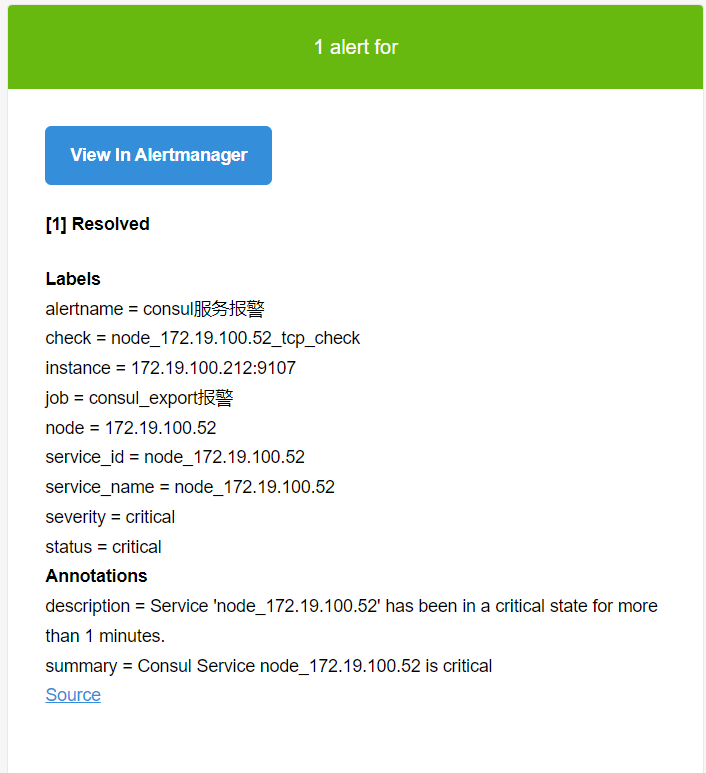
6、報警解除,收到解除郵件
Systemctl start node_exporter后報警消失,發送接觸報警郵件,至此,報警鏈條完美閉環。

 浙公網安備 33010602011771號