Leaflet 軍事標(biāo)繪 復(fù)雜圖形 實(shí)現(xiàn)
需求
看到別的公司做的要圖標(biāo)繪,我們也想做一個,所以我就研究一下怎么實(shí)現(xiàn)。
像進(jìn)攻方向、鉗擊、聚集地這些,網(wǎng)上已有大佬開源,我之前已集成到我的Demo中。
要圖標(biāo)繪的標(biāo)號雖然很多,多數(shù)都是點(diǎn)狀的,相對比較簡單。有些線狀的比較復(fù)雜,如下圖所示:
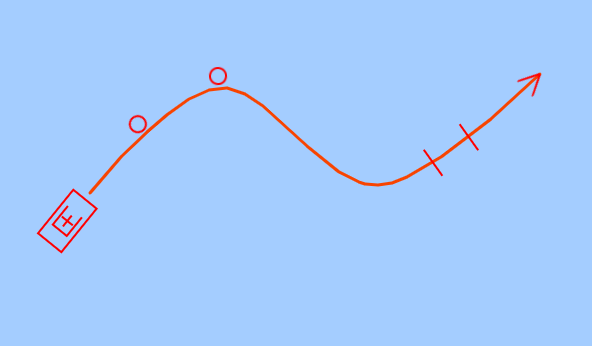
說明:因?yàn)槲覜]有相關(guān)的svg圖形,使用其它svg圖形拼湊的,圖形本身是個四不像,后面只要換一下svg圖形就行了。
這篇文章主要講解一下,我是如何實(shí)現(xiàn)的。
實(shí)現(xiàn)原理
- 樣條曲線
為什么是樣條曲線而不是二次或三次貝塞爾曲線呢?因?yàn)椴淮_定繪制幾個點(diǎn)。
我的算法基礎(chǔ)比較弱,以前我只能上網(wǎng)搜索開源代碼,現(xiàn)在直接問DeepSeek就可以了,我讓它封裝成js方法,這種經(jīng)典算法,它給的封裝好的js方法可以正確運(yùn)行。 - svg圖形
曲線上的圖形,通過svg實(shí)現(xiàn)。項(xiàng)目中用到的標(biāo)號,也是通過svg格式提供的。 - svg圖形的旋轉(zhuǎn)角度
接下來最關(guān)鍵的,就是svg圖形的旋轉(zhuǎn)角度,這個算法,問DeepSeek不太好問,它也很難一次性給出正確的代碼,所以主要是自己寫。
樣條曲線算法
樣條曲線算法
/**
 * 獲取樣條插值曲線點(diǎn)的坐標(biāo)
 * @param {Array} points - 輸入的坐標(biāo)點(diǎn)數(shù)組,格式為 [[number, number], ...]
 * @param {number} numSegments - 每兩個原始點(diǎn)之間的曲線分段數(shù)
 * @returns {Array} 平滑曲線的坐標(biāo)點(diǎn)數(shù)組
 */
L.PlotUtils.getSplineCurve = function (points, numSegments = 25) {
    if (points.length < 2) return points.slice();

    // 擴(kuò)展點(diǎn)數(shù)組處理邊界情況
    const extendedPoints = [
        points[1],          // 添加第二個點(diǎn)作為起始虛擬點(diǎn)
        ...points,          // 原始點(diǎn)
        points[points.length - 2] // 添加倒數(shù)第二個點(diǎn)作為結(jié)束虛擬點(diǎn)
    ];

    const curvePoints = [];

    // 遍歷每個中間段生成曲線
    for (let i = 1; i <= extendedPoints.length - 3; i++) {
        const p0 = extendedPoints[i - 1];
        const p1 = extendedPoints[i];
        const p2 = extendedPoints[i + 1];
        const p3 = extendedPoints[i + 2];

        // 生成當(dāng)前段的曲線點(diǎn)
        for (let t = 0; t < 1; t += 1 / numSegments) {
            const t2 = t * t;
            const t3 = t2 * t;

            // Catmull-Rom樣條插值公式
            const x = 0.5 * (
                (2 * p1[0]) +
                (-p0[0] + p2[0]) * t +
                (2 * p0[0] - 5 * p1[0] + 4 * p2[0] - p3[0]) * t2 +
                (-p0[0] + 3 * p1[0] - 3 * p2[0] + p3[0]) * t3
            );

            const y = 0.5 * (
                (2 * p1[1]) +
                (-p0[1] + p2[1]) * t +
                (2 * p0[1] - 5 * p1[1] + 4 * p2[1] - p3[1]) * t2 +
                (-p0[1] + 3 * p1[1] - 3 * p2[1] + p3[1]) * t3
            );

            curvePoints.push({ x, y });
        }
    }

    // 確保包含最后一個原始點(diǎn)
    let lastPoint = points[points.length - 1];
    curvePoints.push({ x: lastPoint[0], y: lastPoint[1] });

    return curvePoints;
}
切線算法
/**
 * 計算樣條曲線在指定百分比位置的坐標(biāo)及切線向量
 * @param {Array} points - 原始坐標(biāo)點(diǎn)數(shù)組,格式 [{x: number, y: number}, ...]
 * @param {number} t - 曲線位置百分比參數(shù),取值范圍 [0, 1]
 * @returns {Object} 包含坐標(biāo)和切線的對象 {x, y, dx, dy}
 */
L.PlotUtils.getSplineCurvePointAndTangent = function (points, t) {
    if (points.length < 2) return { x: 0, y: 0, dx: 0, dy: 0 };

    // 按曲線總長度的百分比
    let tR;
    if (t == 0 || t == 1) {
        tR = t;
    }
    else {
        let points2 = [];
        for (let p of points) {
            points2.push([p.x, p.y]);
        }
        let totalDistance = L.PlotUtils.wholeDistance(points2);

        let sum = 0;
        let index = 0;
        for (let i = 1; i < points2.length; i++) {
            let d = L.PlotUtils.distance(points2[i - 1], points2[i]);
            sum += d;
            if (sum >= totalDistance * t) {
                index = i;
                break;
            }
        }

        tR = index / points2.length;
    }

    // 參數(shù)約束處理(轉(zhuǎn)換為全局位置)
    const totalSegments = points.length - 1;
    let tGlobal = Math.max(0, Math.min(tR, 1)) * totalSegments;
    tGlobal = Math.min(tGlobal, totalSegments - 1e-9); // 防止超出最后一個點(diǎn)

    // 創(chuàng)建鏡像端點(diǎn)解決邊界問題
    const first = points[0], last = points[points.length - 1];
    const extended = [
        { x: 2 * first.x - points[1].x, y: 2 * first.y - points[1].y },
        ...points,
        { x: 2 * last.x - points[points.length - 2].x, y: 2 * last.y - points[points.length - 2].y }
    ];

    // 確定當(dāng)前曲線段
    const segIndex = Math.floor(tGlobal);
    const localT = tGlobal - segIndex;

    // 獲取控制點(diǎn)集(調(diào)整索引偏移)
    const p0 = extended[segIndex];
    const p1 = extended[segIndex + 1];
    const p2 = extended[segIndex + 2];
    const p3 = extended[segIndex + 3];

    // 計算坐標(biāo)點(diǎn)
    const t2 = localT * localT;
    const t3 = t2 * localT;
    const x = 0.5 * (
        (2 * p1.x) +
        (-p0.x + p2.x) * localT +
        (2 * p0.x - 5 * p1.x + 4 * p2.x - p3.x) * t2 +
        (-p0.x + 3 * p1.x - 3 * p2.x + p3.x) * t3
    );
    const y = 0.5 * (
        (2 * p1.y) +
        (-p0.y + p2.y) * localT +
        (2 * p0.y - 5 * p1.y + 4 * p2.y - p3.y) * t2 +
        (-p0.y + 3 * p1.y - 3 * p2.y + p3.y) * t3
    );

    // 計算切線向量
    const dx = 0.5 * (
        (-p0.x + p2.x) +
        2 * (2 * p0.x - 5 * p1.x + 4 * p2.x - p3.x) * localT +
        3 * (-p0.x + 3 * p1.x - 3 * p2.x + p3.x) * t2
    );
    const dy = 0.5 * (
        (-p0.y + p2.y) +
        2 * (2 * p0.y - 5 * p1.y + 4 * p2.y - p3.y) * localT +
        3 * (-p0.y + 3 * p1.y - 3 * p2.y + p3.y) * t2
    );

    return { x, y, dx, dy };
}
判斷三點(diǎn)構(gòu)成的曲線彎曲方向
如上圖所示,圓圈需要根據(jù)曲線彎曲方向調(diào)整到曲線的一側(cè)
/**
 * 判斷三點(diǎn)構(gòu)成的曲線彎曲方向
 * @param {Object} A - 起點(diǎn)坐標(biāo) [ number, number ]
 * @param {Object} B - 中間點(diǎn)坐標(biāo) [ number, number ]
 * @param {Object} C - 終點(diǎn)坐標(biāo) [ number, number ]
 * @returns {'left' | 'right' | 'straight'} 彎曲方向
 */
L.PlotUtils.determineCurveDirection = function (A, B, C) {
    // 計算向量AB和BC
    const abx = B[0] - A[0];
    const aby = B[1] - A[1];
    const bcx = C[0] - B[0];
    const bcy = C[1] - B[1];

    // 計算叉積 (AB × BC)
    const crossProduct = abx * bcy - aby * bcx;

    // 處理浮點(diǎn)數(shù)精度誤差(閾值可調(diào)整)
    const epsilon = 1e-8;
    if (crossProduct > epsilon) return 'left';    // 逆時針方向
    if (crossProduct < -epsilon) return 'right';  // 順時針方向
    return 'straight';  // 三點(diǎn)共線
}
svg圖形旋轉(zhuǎn)算法
不需要考慮曲線彎曲方向的情況
L.Plot.SplineCurve.prototype.getRotation = function (angle, scale, lineWidth) {
    let rotation = Math.atan2(angle.dy, angle.dx);
    rotation = -180 * rotation / Math.PI;
    let strokeWidth = lineWidth / scale;

    if (Math.abs(rotation) < 90) {
        transform = `transform: scale(${scale},${scale}); transform-origin: center right;`;
    } else {
        transform = `transform: scale(${scale},-${scale}); transform-origin: center right;`;
    }

    return { rotation, transform, strokeWidth }
}
需要考慮曲線彎曲方向的情況
L.Plot.SplineCurve.prototype.getRotation2 = function (angle, direction, scale, lineWidth) {
    let rotation = Math.atan2(angle.dy, angle.dx);
    rotation = -180 * rotation / Math.PI;
    let strokeWidth = lineWidth / scale;

    if (Math.abs(rotation) < 90) {
        if (direction == 'left') {
            rotation = 180 + rotation;
        }
        transform = `transform: scale(${scale},${scale}); transform-origin: center center;`;
    } else {
        if (direction == 'right') {
            rotation = 180 + rotation;
        }
        transform = `transform: scale(${scale},-${scale}); transform-origin: center center;`;
    }

    return { rotation, transform, strokeWidth }
}
標(biāo)繪圖形封裝
基于樣條曲線,可以實(shí)現(xiàn)多種同類標(biāo)繪圖形,這里實(shí)現(xiàn)了三種標(biāo)繪圖形
// 組合圖形
L.Plot.CompositeGraphic = function (points, options) {
    this.points = points;
    this.options = {};
    Object.assign(this.options, options);
}
L.Plot.CompositeGraphic.prototype.convertLatLngs = function (points) {
    let pnts = [];
    for (let point of points) {
        pnts.push({ lat: point[0], lng: point[1] });
    }
    return pnts;
}
L.Plot.CompositeGraphic.prototype.getPointCount = function () {
    return this.points.length;
}
L.Plot.CompositeGraphic.prototype.getPoints = function () {
    return this.points;
}

// 樣條曲線
L.Plot.SplineCurve = function (points, options) {
    L.Plot.CompositeGraphic.call(this, points, options); // 調(diào)用父類構(gòu)造函數(shù)

    this.points = points;
    this.options = {
        fixPointCount: 6
    }
    Object.assign(this.options, options);
    this.type = L.PlotTypes.SPLINECURVE;
}
// 繼承原型
L.Plot.SplineCurve.prototype = Object.create(L.Plot.CompositeGraphic.prototype);
L.Plot.SplineCurve.prototype.constructor = L.Plot.SplineCurve;
// 創(chuàng)建樣條曲線
L.Plot.SplineCurve.prototype.create = function (map, plotLayer) {
    this.map = map;
    this.plotLayer = plotLayer;

    this.map.addEventListener("zoomend", this.mapZoomEnd, this);

    let polyline = L.polyline([], { color: this.options.color, opacity: this.options.opacity || 1 });
    this.plotLayer.addLayer(polyline);
    polyline.plot = this;
    this.polyline = polyline;
    this.layer = polyline;

    this.svgMarker = L.marker(this.points[0])
    this.svgMarker.setRotationOrigin('50% 50%');
    this.plotLayer.addLayer(this.svgMarker);

    this.arrowMarker = L.marker(this.points[0])
    this.arrowMarker.setRotationOrigin('50% 50%');
    this.plotLayer.addLayer(this.arrowMarker);

    let zoom = this.map.getZoom();
    let scale = Math.pow(1.2, (zoom - 14));
    this.updateIcons(scale);
}
// 地圖放大縮小
L.Plot.SplineCurve.prototype.mapZoomEnd = function (e) {
    let zoom = this.map.getZoom();
    let scale = Math.pow(1.2, (zoom - 14));
    this.updateIcons(scale);
}
L.Plot.SplineCurve.prototype.setPoints = function (points) {
    this.points = points;
    if (this.points.length < 2) {
        return;
    }

    let proPoints = L.PlotUtils.proPoints(this.convertLatLngs(this.points));

    let pList = L.PlotUtils.getSplineCurve(proPoints);

    let latlngs = L.PlotUtils.unProPoints(pList);
    this.polyline.setLatLngs(latlngs);

    this.svgMarker.setLatLng(L.PlotUtils.unProPoint(pList[0]));
    this.arrowMarker.setLatLng(L.PlotUtils.unProPoint(pList[pList.length - 1]));

    let zoom = this.map.getZoom();
    let scale = Math.pow(1.2, (zoom - 14));
    this.updateIcons(scale);
}
L.Plot.SplineCurve.prototype.getRotation = function (angle, scale, lineWidth) {
    let rotation = Math.atan2(angle.dy, angle.dx);
    rotation = -180 * rotation / Math.PI;
    let strokeWidth = lineWidth / scale;

    if (Math.abs(rotation) < 90) {
        transform = `transform: scale(${scale},${scale}); transform-origin: center right;`;
    } else {
        transform = `transform: scale(${scale},-${scale}); transform-origin: center right;`;
    }

    return { rotation, transform, strokeWidth }
}
L.Plot.SplineCurve.prototype.getRotation2 = function (angle, direction, scale, lineWidth) {
    let rotation = Math.atan2(angle.dy, angle.dx);
    rotation = -180 * rotation / Math.PI;
    let strokeWidth = lineWidth / scale;

    if (Math.abs(rotation) < 90) {
        if (direction == 'left') {
            rotation = 180 + rotation;
        }
        transform = `transform: scale(${scale},${scale}); transform-origin: center center;`;
    } else {
        if (direction == 'right') {
            rotation = 180 + rotation;
        }
        transform = `transform: scale(${scale},-${scale}); transform-origin: center center;`;
    }

    return { rotation, transform, strokeWidth }
}
L.Plot.SplineCurve.prototype.updateIcons = function (scale) {
    let proPoints = L.PlotUtils.proPoints(this.convertLatLngs(this.points));

    let pList = L.PlotUtils.getSplineCurve(proPoints);

    // 切線
    let angle = L.PlotUtils.getSplineCurvePointAndTangent(pList, 0);

    this.updateSvgIcon(angle, scale);

    angle = L.PlotUtils.getSplineCurvePointAndTangent(pList, 1);
    this.updateArrowMarkerIcon(angle, scale * 0.3);
}
L.Plot.SplineCurve.prototype.updateSvgIcon = function (angle, scale) {
    let lineWidth = 2;
    let { rotation, transform, strokeWidth } = this.getRotation(angle, scale, lineWidth);

    // 顯示svg圖標(biāo)
    let svgIcon = L.divIcon({
        html: `
        <div style="width:144px; height:144px; background:transparent;">
        <svg width="72" height="72" viewBox="0 0 72 72" fill="none" style="margin-left:0; margin-top:36px; ${transform}" xmlns="http://www.w3.org/2000/svg">

        <rect x="8" y="20" width="56" height="28" stroke="#FF0000" stroke-width="${strokeWidth}"/>
<path d="M59 20V48" stroke="#FF0000" stroke-width="${strokeWidth}"/>
<path d="M7 53H65" stroke="#FF0000" stroke-width="${strokeWidth}" stroke-linejoin="bevel"/>

        </svg>
        <div>
        `,
        className: 'plot-svg-marker',
        iconSize: [144, 144],  // 圖標(biāo)顯示尺寸
        iconAnchor: [72, 72] // 圖標(biāo)錨點(diǎn)位置
    });
    this.svgMarker.setIcon(svgIcon);
    this.svgMarker.setRotationAngle(rotation);
}
L.Plot.SplineCurve.prototype.updateArrowMarkerIcon = function (angle, scale) {
    let lineWidth = 2;
    let { rotation, transform, strokeWidth } = this.getRotation(angle, scale, lineWidth);

    // 顯示svg圖標(biāo)
    let svgIcon = L.divIcon({
        html: `
        <div style="width:144px; height:144px; background:transparent;">
        <svg width="72" height="72" viewBox="0 0 72 72" fill="none" style="margin-left:0; margin-top:36px; ${transform}" xmlns="http://www.w3.org/2000/svg">

            <path d="M0 0 L72 36 L0 72" stroke="#FF0000" stroke-width="${strokeWidth}" stroke-linejoin="bevel"/>

        </svg>
        <div>
        `,
        className: 'plot-svg-marker',
        iconSize: [144, 144],  // 圖標(biāo)顯示尺寸
        iconAnchor: [72, 72] // 圖標(biāo)錨點(diǎn)位置
    });
    this.arrowMarker.setIcon(svgIcon);
    this.arrowMarker.setRotationAngle(rotation);
}
L.Plot.SplineCurve.prototype.finishDrawing = function () { }
// 釋放資源
L.Plot.SplineCurve.prototype.dispose = function (e) {
    this.map.removeEventListener("zoomend", this.mapZoomEnd, this); // 注意:添加的時候傳了this,移除的時候必需要傳this,否則移除不掉
}

// 樣條曲線 子類型1
L.Plot.SplineCurveSub1 = function (points, options) {
    L.Plot.SplineCurve.call(this, points, options); // 調(diào)用父類構(gòu)造函數(shù)

    this.points = points;
    this.options = {
        fixPointCount: 6
    }
    Object.assign(this.options, options);
    this.type = L.PlotTypes.SPLINECURVE_SUB1;
}
// 繼承原型
L.Plot.SplineCurveSub1.prototype = Object.create(L.Plot.SplineCurve.prototype);
L.Plot.SplineCurveSub1.prototype.constructor = L.Plot.SplineCurveSub1;
// 更新圖標(biāo)
L.Plot.SplineCurveSub1.prototype.updateIcons = function (scale) {
    let proPoints = L.PlotUtils.proPoints(this.convertLatLngs(this.points));

    let pList = L.PlotUtils.getSplineCurve(proPoints);

    // 切線
    let angle = L.PlotUtils.getSplineCurvePointAndTangent(pList, 0);

    this.updateSvgIcon(angle, scale);

    angle = L.PlotUtils.getSplineCurvePointAndTangent(pList, 1);
    this.updateArrowMarkerIcon(angle, scale * 0.3);
}
// 更新圖標(biāo)
L.Plot.SplineCurveSub1.prototype.updateSvgIcon = function (angle, scale) {
    let lineWidth = 2;
    let { rotation, transform, strokeWidth } = this.getRotation(angle, scale, lineWidth);

    // 顯示svg圖標(biāo)
    let svgIcon = L.divIcon({
        html: `
        <div style="width:144px; height:144px; background:transparent;">
        <svg width="72" height="72" viewBox="0 0 72 72" fill="none" style="margin-left:0; margin-top:36px; ${transform}" xmlns="http://www.w3.org/2000/svg">

        <rect x="8" y="20" width="56" height="28" stroke="#FF0000" stroke-width="${strokeWidth}"/>
<path d="M59 20V48" stroke="#FF0000" stroke-width="${strokeWidth}"/>
<path d="M7 53H65" stroke="#FF0000" stroke-width="${strokeWidth}" stroke-linejoin="bevel"/>

        </svg>
        <div>
        `,
        className: 'plot-svg-marker',
        iconSize: [144, 144],  // 圖標(biāo)顯示尺寸
        iconAnchor: [72, 72] // 圖標(biāo)錨點(diǎn)位置
    });
    this.svgMarker.setIcon(svgIcon);
    this.svgMarker.setRotationAngle(rotation);
}

// 樣條曲線 子類型2
L.Plot.SplineCurveSub2 = function (points, options) {
    L.Plot.SplineCurve.call(this, points, options); // 調(diào)用父類構(gòu)造函數(shù)

    this.points = points;
    this.options = {
        fixPointCount: 6
    }
    Object.assign(this.options, options);
    this.type = L.PlotTypes.SPLINECURVE_SUB2;
}
// 繼承原型
L.Plot.SplineCurveSub2.prototype = Object.create(L.Plot.SplineCurve.prototype);
L.Plot.SplineCurveSub2.prototype.constructor = L.Plot.SplineCurveSub2;
// 更新圖標(biāo)
L.Plot.SplineCurveSub2.prototype.updateIcons = function (scale) {
    let proPoints = L.PlotUtils.proPoints(this.convertLatLngs(this.points));

    let pList = L.PlotUtils.getSplineCurve(proPoints);

    // 切線
    let angle = L.PlotUtils.getSplineCurvePointAndTangent(pList, 0);

    this.updateSvgIcon(angle, scale);

    angle = L.PlotUtils.getSplineCurvePointAndTangent(pList, 1);
    this.updateArrowMarkerIcon(angle, scale * 0.3);
}
// 更新圖標(biāo)
L.Plot.SplineCurveSub2.prototype.updateSvgIcon = function (angle, scale) {
    let lineWidth = 2;
    let { rotation, transform, strokeWidth } = this.getRotation(angle, scale, lineWidth);

    // 顯示svg圖標(biāo)
    let svgIcon = L.divIcon({
        html: `
        <div style="width:144px; height:144px; background:transparent;">
        <svg width="72" height="72" viewBox="0 0 72 72" fill="none" style="margin-left:0; margin-top:36px; ${transform}" xmlns="http://www.w3.org/2000/svg">

        <rect x="8" y="21" width="56" height="30" stroke="#FF0000" stroke-width="${strokeWidth}"/>
        <path d="M48 27H24V45H48" stroke="#FF0000" stroke-width="${strokeWidth}"/>
        <path d="M29 36H43" stroke="#FF0000" stroke-width="${strokeWidth}"/>
        <path d="M36 43L36 29" stroke="#FF0000" stroke-width="${strokeWidth}"/>

        </svg>
        <div>
        `,
        className: 'plot-svg-marker',
        iconSize: [144, 144],  // 圖標(biāo)顯示尺寸
        iconAnchor: [72, 72] // 圖標(biāo)錨點(diǎn)位置
    });
    this.svgMarker.setIcon(svgIcon);
    this.svgMarker.setRotationAngle(rotation);
}

// 樣條曲線 子類型3
L.Plot.SplineCurveSub3 = function (points, options) {
    L.Plot.SplineCurve.call(this, points, options); // 調(diào)用父類構(gòu)造函數(shù)

    this.points = points;
    this.options = {
        fixPointCount: 6
    }
    Object.assign(this.options, options);
    this.type = L.PlotTypes.SPLINECURVE_SUB3;
}
// 繼承原型
L.Plot.SplineCurveSub3.prototype = Object.create(L.Plot.SplineCurve.prototype);
L.Plot.SplineCurveSub3.prototype.constructor = L.Plot.SplineCurveSub3;
// 創(chuàng)建樣條曲線
L.Plot.SplineCurveSub3.prototype.create = function (map, plotLayer) {
    this.map = map;
    this.plotLayer = plotLayer;

    this.map.addEventListener("zoomend", this.mapZoomEnd, this);

    let polyline = L.polyline([], { color: this.options.color, opacity: this.options.opacity || 1 });
    this.plotLayer.addLayer(polyline);
    polyline.plot = this;
    this.polyline = polyline;
    this.layer = polyline;

    this.svgMarker = L.marker(this.points[0])
    this.svgMarker.setRotationOrigin('50% 50%');
    this.plotLayer.addLayer(this.svgMarker);

    this.arrowMarker = L.marker(this.points[0])
    this.arrowMarker.setRotationOrigin('50% 50%');
    this.plotLayer.addLayer(this.arrowMarker);

    this.circleMarker1 = L.marker(this.points[0])
    this.circleMarker1.setRotationOrigin('50% 50%');
    this.plotLayer.addLayer(this.circleMarker1);

    this.circleMarker2 = L.marker(this.points[0])
    this.circleMarker2.setRotationOrigin('50% 50%');
    this.plotLayer.addLayer(this.circleMarker2);

    this.marker3 = L.marker(this.points[0])
    this.marker3.setRotationOrigin('50% 50%');
    this.plotLayer.addLayer(this.marker3);

    let zoom = this.map.getZoom();
    let scale = Math.pow(1.2, (zoom - 14));
    this.updateIcons(scale);
}
// 更新圖標(biāo)
L.Plot.SplineCurveSub3.prototype.updateIcons = function (scale) {
    let proPoints = L.PlotUtils.proPoints(this.convertLatLngs(this.points));

    let pList = L.PlotUtils.getSplineCurve(proPoints);

    // 切線
    let angle = L.PlotUtils.getSplineCurvePointAndTangent(pList, 0);

    this.updateSvgIcon(angle, scale);

    angle = L.PlotUtils.getSplineCurvePointAndTangent(pList, 1);
    this.updateArrowMarkerIcon(angle, scale * 0.3);

    let direction = 'straight';
    if (proPoints.length >= 3) {
        direction = L.PlotUtils.determineCurveDirection(proPoints[proPoints.length - 3], proPoints[proPoints.length - 2], proPoints[proPoints.length - 1]);
    }

    angle = L.PlotUtils.getSplineCurvePointAndTangent(pList, 0.15);
    let lnglat = L.PlotUtils.unProPoint({ x: angle.x, y: angle.y });
    this.updateCircleIcon1(angle, direction, scale, lnglat);

    angle = L.PlotUtils.getSplineCurvePointAndTangent(pList, 0.3);
    lnglat = L.PlotUtils.unProPoint({ x: angle.x, y: angle.y });
    this.updateCircleIcon2(angle, direction, scale, lnglat);

    angle = L.PlotUtils.getSplineCurvePointAndTangent(pList, 0.8);
    lnglat = L.PlotUtils.unProPoint({ x: angle.x, y: angle.y });
    this.updateIcon3(angle, direction, scale, lnglat);
}
// 更新圖標(biāo)
L.Plot.SplineCurveSub3.prototype.updateSvgIcon = function (angle, scale) {
    let lineWidth = 2;
    let { rotation, transform, strokeWidth } = this.getRotation(angle, scale, lineWidth);

    // 顯示svg圖標(biāo)
    let svgIcon = L.divIcon({
        html: `
        <div style="width:144px; height:144px; background:transparent;">
        <svg width="72" height="72" viewBox="0 0 72 72" fill="none" style="margin-left:0; margin-top:36px; ${transform}" xmlns="http://www.w3.org/2000/svg">

        <rect x="8" y="21" width="56" height="30" stroke="#FF0000" stroke-width="${strokeWidth}"/>
        <path d="M48 27H24V45H48" stroke="#FF0000" stroke-width="${strokeWidth}"/>
        <path d="M29 36H43" stroke="#FF0000" stroke-width="${strokeWidth}"/>
        <path d="M36 43L36 29" stroke="#FF0000" stroke-width="${strokeWidth}"/>

        </svg>
        <div>
        `,
        className: 'plot-svg-marker',
        iconSize: [144, 144],  // 圖標(biāo)顯示尺寸
        iconAnchor: [72, 72] // 圖標(biāo)錨點(diǎn)位置
    });
    this.svgMarker.setIcon(svgIcon);
    this.svgMarker.setRotationAngle(rotation);
}
// 更新圖標(biāo)
L.Plot.SplineCurveSub3.prototype.updateCircleIcon1 = function (angle, direction, scale, lnglat) {
    let lineWidth = 2;
    let { rotation, transform, strokeWidth } = this.getRotation2(angle, direction, scale, lineWidth);

    // 顯示svg圖標(biāo)
    let svgIcon = L.divIcon({
        html: `
        <div style="width:48px; height:48px; background:transparent;">
        <svg width="48" height="48" viewBox="0 0 48 48" fill="none" style="margin-left:0; margin-top:0; ${transform}" xmlns="http://www.w3.org/2000/svg">

        <circle cx="24" cy="38" r="8" stroke="red" stroke-width="${strokeWidth}" fill="none"/>

        </svg>
        <div>
        `,
        className: 'plot-svg-marker',
        iconSize: [48, 48],  // 圖標(biāo)顯示尺寸
        iconAnchor: [24, 24] // 圖標(biāo)錨點(diǎn)位置
    });
    this.circleMarker1.setIcon(svgIcon);
    this.circleMarker1.setRotationAngle(rotation);
    this.circleMarker1.setLatLng(lnglat);
}
// 更新圖標(biāo)
L.Plot.SplineCurveSub3.prototype.updateCircleIcon2 = function (angle, direction, scale, lnglat) {
    let lineWidth = 2;
    let { rotation, transform, strokeWidth } = this.getRotation2(angle, direction, scale, lineWidth);

    // 顯示svg圖標(biāo)
    let svgIcon = L.divIcon({
        html: `
        <div style="width:48px; height:48px; background:transparent;">
        <svg width="48" height="48" viewBox="0 0 48 48" fill="none" style="margin-left:0; margin-top:0; ${transform}" xmlns="http://www.w3.org/2000/svg">

        <circle cx="24" cy="38" r="8" stroke="red" stroke-width="${strokeWidth}" fill="none"/>

        </svg>
        </div>
        `,
        className: 'plot-svg-marker',
        iconSize: [48, 48],  // 圖標(biāo)顯示尺寸
        iconAnchor: [24, 24] // 圖標(biāo)錨點(diǎn)位置
    });
    this.circleMarker2.setIcon(svgIcon);
    this.circleMarker2.setRotationAngle(rotation);
    this.circleMarker2.setLatLng(lnglat);
}
// 更新圖標(biāo)
L.Plot.SplineCurveSub3.prototype.updateIcon3 = function (angle, direction, scale, lnglat) {
    let lineWidth = 2;
    let { rotation, transform, strokeWidth } = this.getRotation2(angle, direction, scale, lineWidth);

    // 顯示svg圖標(biāo)
    let svgIcon = L.divIcon({
        html: `
        <div style="width:48px; height:36px; background:transparent;">
        <svg width="48" height="36" viewBox="0 0 48 36" fill="none" style="margin-left:0; margin-top:0; ${transform}" xmlns="http://www.w3.org/2000/svg">

        <path d="M2 2 L2 34" stroke="#FF0000" stroke-width="${strokeWidth}" stroke-linejoin="bevel"/>
        <path d="M46 2 L46 34" stroke="#FF0000" stroke-width="${strokeWidth}" stroke-linejoin="bevel"/>

        </svg>
        </div>
        `,
        className: 'plot-svg-marker',
        iconSize: [48, 36],  // 圖標(biāo)顯示尺寸
        iconAnchor: [24, 18] // 圖標(biāo)錨點(diǎn)位置
    });
    this.marker3.setIcon(svgIcon);
    this.marker3.setRotationAngle(rotation);
    this.marker3.setLatLng(lnglat);
}
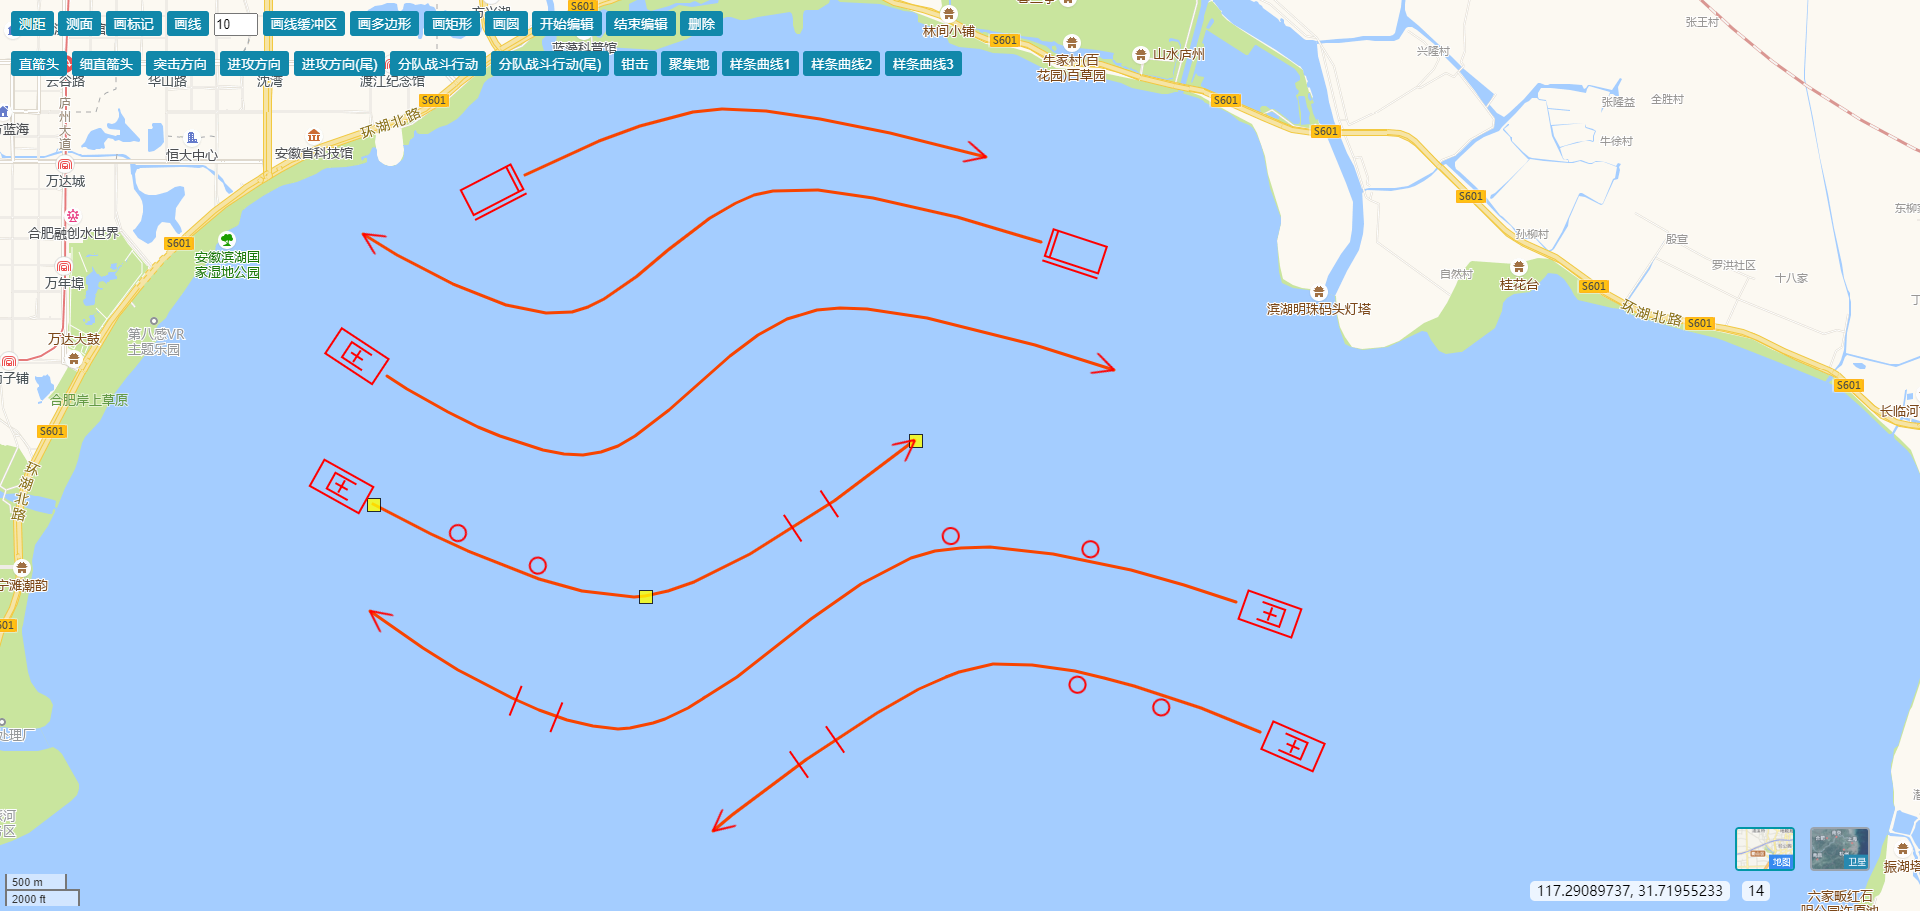
截圖

 浙公網(wǎng)安備 33010602011771號