16 下載數據
16.1 CSV文件格式
16.1.1 分析CSV文件頭
import csv

filename = 'sitka_weather_07-2014.csv'
with open(filename) as f:
    reader = csv.reader(f)
    header_row = next(reader)
    print(header_row)

16.1.2 打印文件頭及其位置
import csv

filename ='sitka_weather_07-2014.csv'
with open(filename) as f:
    reader = csv.reader(f)
    header_row = next(reader)

    for index,cloum_header in enumerate(header_row):
        print(index,cloum_header)

16.3.1 提取并讀取數據
import csv

# 從文件中獲取最高氣溫
filename = 'sitka_weather_07-2014.csv'
with open(filename) as f:
    reader = csv.reader(f)
    header_row = next(reader)

    highs = []
    for row in reader:
        highs.append(row[1])

    print(highs)

import csv

#從文件中獲取最高氣溫
filename = 'sitka_weather_07-2014.csv'
with open(filename) as f:
    reader = csv.reader(f)
    header_row = next(reader)

    highs = []
    for row in reader:
        high = int(row[1])
        highs.append(high)

    print(highs)

16.1.4 繪制氣溫圖標
import csv

from matplotlib import pyplot as plt

# 從文件中獲取最高氣溫
filename = 'sitka_weather_07-2014.csv'
with open(filename) as f:
    reader = csv.reader(f)
    header_row = next(reader)

    highs = []
    for row in reader:
        high = int(row[1])
        highs.append(high)

# 根據數據繪制圖形
fig = plt.figure(dpi=128,figsize=(10,6))
plt.plot(highs,c='red')

#設置圖形的格式
plt.title("Daily high temperatures, July 2014",fontsize = 24)
plt.xlabel('',fontsize=16)
plt.ylabel("Temperature (F)", fontsize=16)
plt.tick_params(axis='both', which='major', labelsize=16)

plt.show()

16.1.5模塊datetime
from datetime import datetime
first_date = datetime.strptime('2014-7-1','%Y-%m-%d')
print(first_date)

16.1.6 在圖表中添加日期
import csv
from datetime import datetime
from matplotlib import pyplot as plt

#從文件中獲取日期和最高氣溫
filename = 'sitka_weather_07-2014.csv'
with open(filename) as f:
    reader = csv.reader(f)
    header_row = next(reader)

    dates,highs = [],[]
    for row in reader:
        current_date = datetime.strptime(row[0],"%Y-%m-%d")
        dates.append(current_date)
        high = int(row[1])
        highs.append(high)

# 根據數據繪制圖形
fig = plt.figure(dpi=128,figsize=(10,6))
plt.plot(dates,highs,c='red')

# 設置圖形的格式
plt.title("Daily high temperatures, July 2014", fontsize=24)
plt.xlabel('',fontsize=16)
fig.autofmt_xdate()
plt.ylabel("Temperature (F)", fontsize=16)
plt.tick_params(axis='both',which='major',labelsize=16)

plt.show()

16.1.7覆蓋更長的時間
import csv
from datetime import datetime
from matplotlib import pyplot as plt

# 從文件中獲取日期和最高氣溫
filename = 'sitka_weather_2014.csv'
with open(filename) as f:
    reader = csv.reader(f)
    header_row = next(reader)

    dates,highs = [],[]
    for row in reader:
        current_date = datetime.strptime(row[0],"%Y-%m-%d")
        dates.append(current_date)
        high = int(row[1])
        highs.append(high)

# 根據數據繪制圖形
fig = plt.figure(dpi=128,figsize=(10,6))
plt.plot(dates,highs,c='red')

plt.title("Daily high temperatures - 2014", fontsize=24)
plt.xlabel('', fontsize=16)
fig.autofmt_xdate()
plt.ylabel("Temperature (F)", fontsize=16)
plt.tick_params(axis='both',which='major',labelsize=16)

plt.show()

16.1.8 再繪制一個數據系列
import csv
from datetime import datetime
from matplotlib import pyplot as plt

# 從文件中獲取日期和最高氣溫
filename = 'sitka_weather_2014.csv'
with open(filename) as f:
    reader = csv.reader(f)
    header_row = next(reader)

    dates, highs, lows = [], [], []
    for row in reader:
        current_date = datetime.strptime(row[0],"%Y-%m-%d")
        dates.append(current_date)

        high = int(row[1])
        highs.append(high)

        low = int(row[3])
        lows.append(low)

        # 根據數據繪制圖形
fig = plt.figure(dpi=128,figsize=(10,6))
plt.plot(dates,highs,c='red')
plt.plot(dates,lows,c='blue')

plt.title("Daily high temperatures - 2014", fontsize=24)
plt.xlabel('', fontsize=16)
fig.autofmt_xdate()
plt.ylabel("Temperature (F)", fontsize=16)
plt.tick_params(axis='both',which='major',labelsize=16)

plt.show()

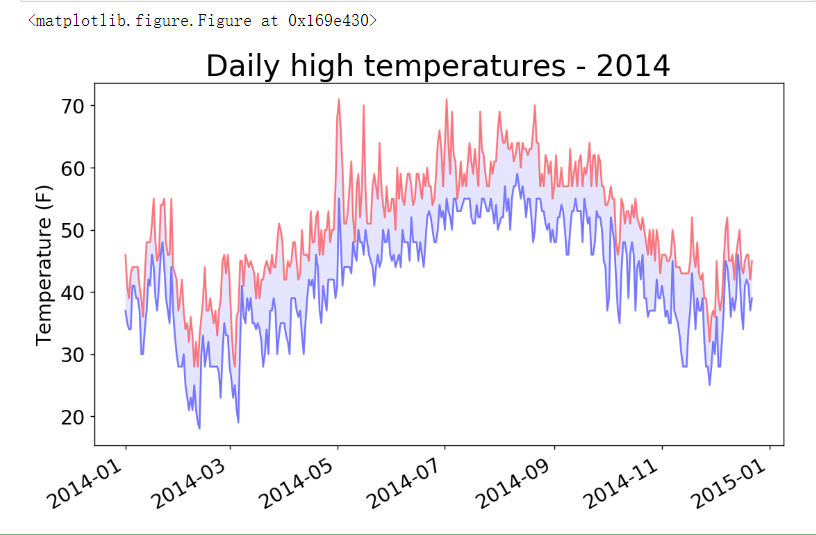
16.1.9 給圖片區域著色
import csv
from datetime import datetime
from matplotlib import pyplot as plt

# 從文件中獲取日期和最高氣溫
filename = 'sitka_weather_2014.csv'
with open(filename) as f:
    reader = csv.reader(f)
    header_row = next(reader)

    dates, highs, lows = [], [], []
    for row in reader:
        current_date = datetime.strptime(row[0],"%Y-%m-%d")
        dates.append(current_date)

        high = int(row[1])
        highs.append(high)

        low = int(row[3])
        lows.append(low)

# 根據數據繪制圖形
fig = plt.figure(dpi=128,figsize=(10,6))
plt.plot(dates,highs,c='red',alpha=0.5)
plt.plot(dates,lows,c='blue',alpha=0.5)
plt.fill_between(dates, highs, lows, facecolor='blue', alpha=0.1)

plt.title("Daily high temperatures - 2014", fontsize=24)
plt.xlabel('', fontsize=16)
fig.autofmt_xdate()
plt.ylabel("Temperature (F)", fontsize=16)
plt.tick_params(axis='both',which='major',labelsize=16)

plt.show()


 浙公網安備 33010602011771號