
小程序引入echarts
1、去官網資源地址下載
https://github.com/ecomfe/echarts-for-weixin
下載解壓git項目,查看目錄,將文件夾ec-canvas,復制到小程序內pages同級目錄


注意事項:
在ec-canvas文件夾內的echarts.js,不能超過500kb,否則警告,且無法渲染;
通過 https://echarts.apache.org/zh/builder.html ,進行定制化,用到什么表格,就勾選哪個。
2、頁面上使用(組件)
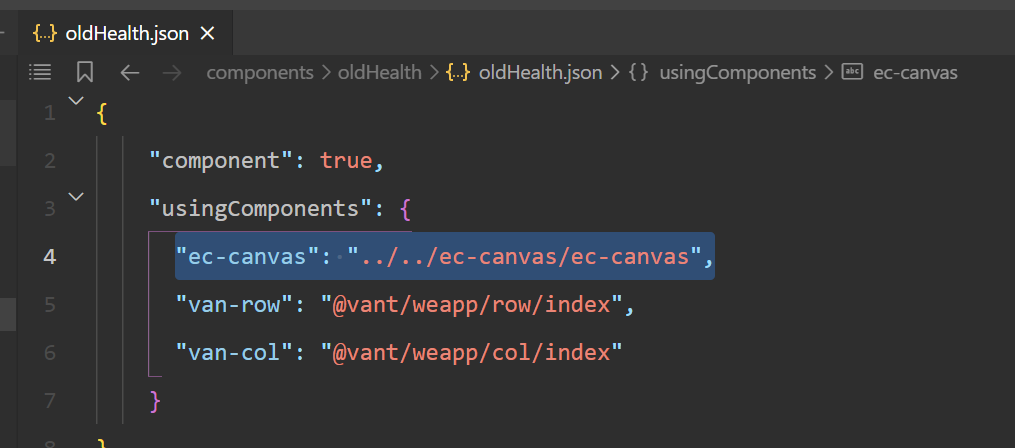
.json引入
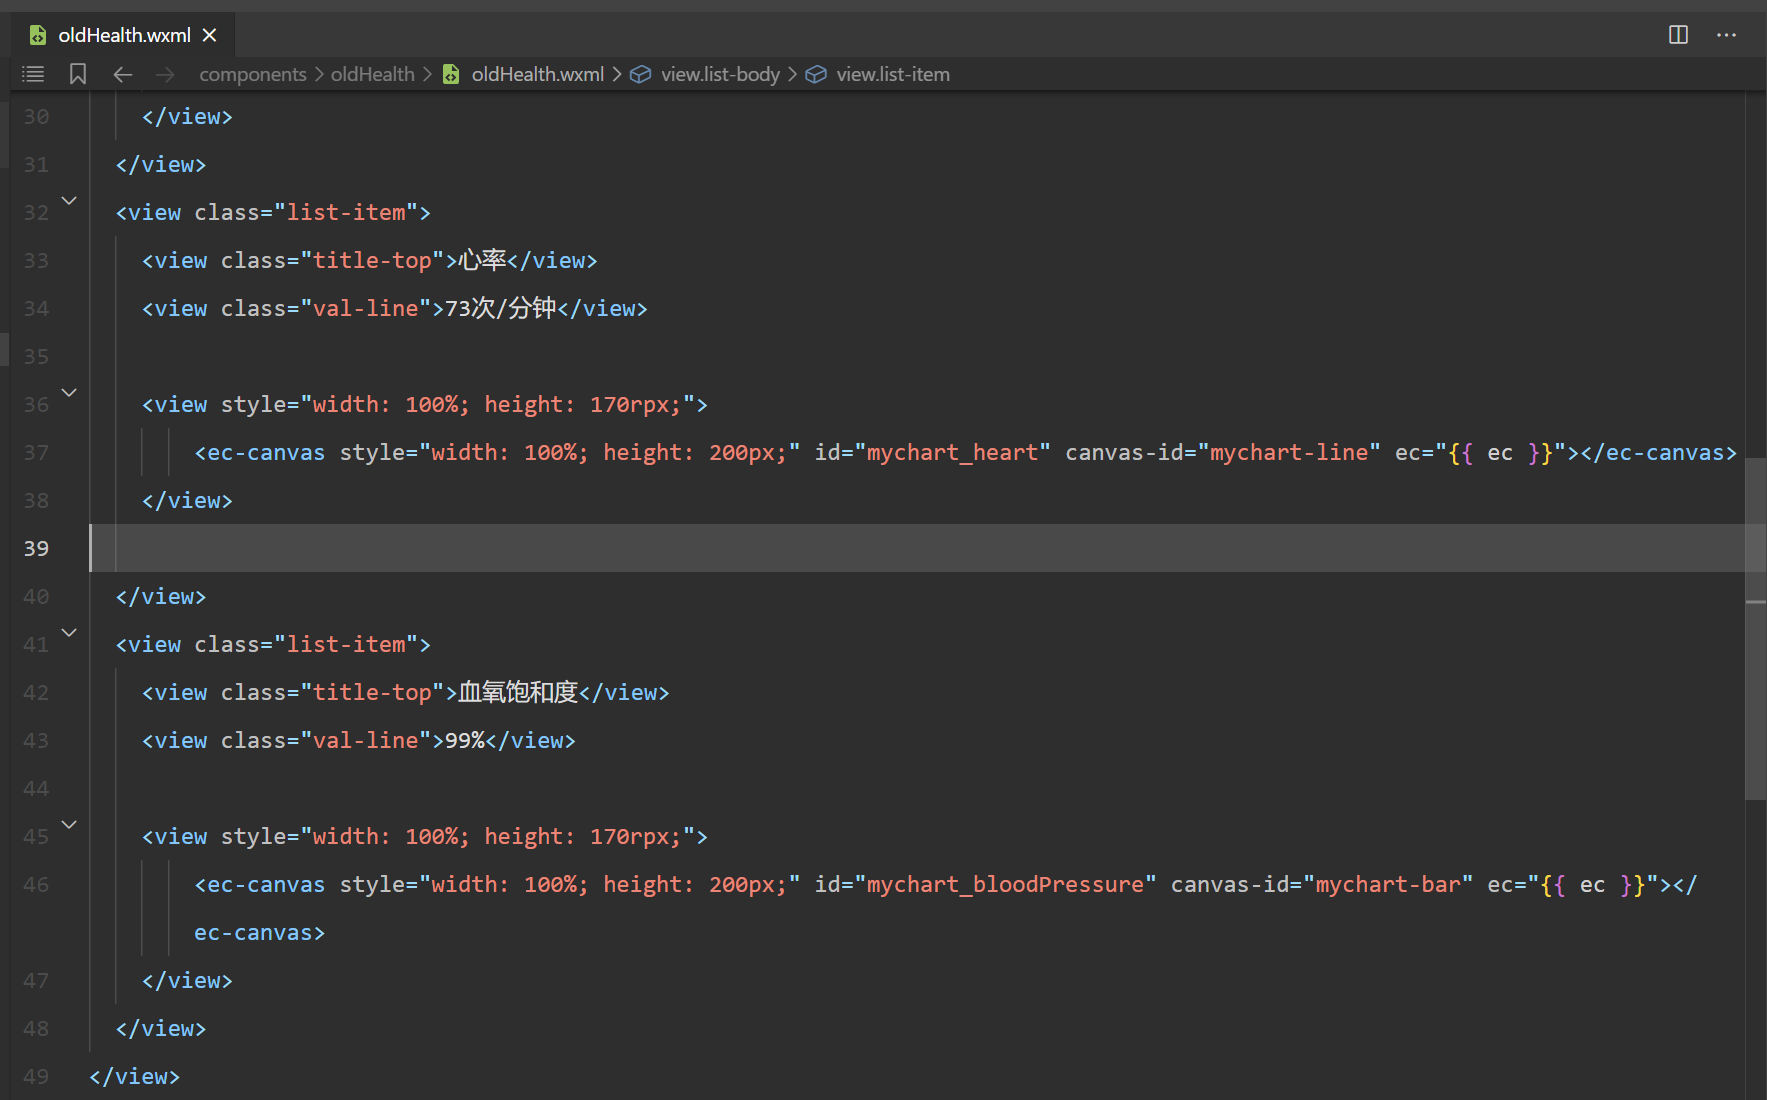
.wxml
.js
// 組件渲染完成時
ready () {
this.init_line()
this.init_bar()
},
methods: {
// 加載心率折線圖
init_line () {
//處理數據
let dates = ["8.14","8.15","8.16","8.17","8.18","8.19","8.20","8.21","8.22"]
let points = [56,106,67,134,35,56,107,56,67]
// 指定圖表的配置項和數據
var option = {
//直角坐標系內繪圖網格,單個 grid 內最多可以放置上下兩個 X 軸,左右兩個 Y 軸。
//用他可以配置圖形在父元素中的位置
grid:{top: 30, left: 0, right: 0, height: "45%"},
//x軸
xAxis: {
type: 'category',
boundaryGap: false,
data: dates,
axisLine: { show: false, },
axisTick: { show: false, },
show: false
},
//y軸
yAxis: {
x: 'center',
type: 'value',
splitLine: { lineStyle: { type: 'dashed' } },
show: false
},
//數據
series: [{
// connectNulls: true,
name: 'A',
type: 'line',
// smooth: true,
data: points,
lineStyle: { normal: { color: '#d2525c', }
},
areaStyle: { color: '#d2525c', opacity: 0.15 },
label: {
show: false,
position:'top',
distance:-28,
textStyle: { fontSize: 12, color: "#17998C" },
formatter:function(value){
let valueType
if(value.dataIndex%2!=0){
valueType="shuang";
return value.data ;
}else{
valueType="dan";
return value.data + '\n\n\n';
}
},
}
}]
}
//小程序的仿dom操作獲取元素
this.echartsComponnet = this.selectComponent('#mychart_heart');
this.echartsComponnet.init((canvas, width, height) => {
// 初始化圖表
const Chart = echarts.init(canvas, null, {
width: width,
height: height
});
Chart.setOption(option);
// 注意這里一定要返回 chart 實例,否則會影響事件處理等
return Chart;
});
},
// 加載血氧飽和度
init_bar () {
//處理數據
let dates = ["8.14","8.15","8.16","8.17","8.18","8.19","8.20","8.21","8.22"]
let points = [56,106,67,134,35,56,107,56,67]
// 指定圖表的配置項和數據
var option = {
//直角坐標系內繪圖網格,單個 grid 內最多可以放置上下兩個 X 軸,左右兩個 Y 軸。
//用他可以配置圖形在父元素中的位置
grid:{top: 30, left: 0, right: 0, height: "45%"},
//x軸
xAxis: {
type: 'category',
boundaryGap: false,
data: dates,
axisLine: { show: false, },
axisTick: { show: false, },
show: false
},
//y軸
yAxis: {
x: 'center',
type: 'value',
splitLine: { lineStyle: { type: 'dashed' } },
show: false
},
//數據
series: [{
// connectNulls: true,
name: 'A',
type: 'bar',
// smooth: true,
data: points,
barWidth: 8,
color: ['#33be7b']
}]
}
//小程序的仿dom操作獲取元素
this.echartsComponnet = this.selectComponent('#mychart_bloodPressure');
this.echartsComponnet.init((canvas, width, height) => {
// 初始化圖表
const Chart = echarts.init(canvas, null, {
width: width,
height: height
});
Chart.setOption(option);
// 注意這里一定要返回 chart 實例,否則會影響事件處理等
return Chart;
});
}
}
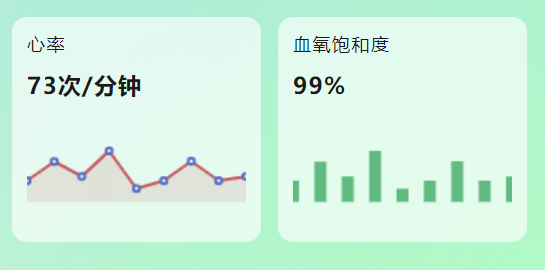
3、效果

 浙公網安備 33010602011771號