在 Github Action 管道內集成 Code Coverage Report
Github Actions
我們的開源項目 Host 在 Github,并且使用它強大的 Actions 功能在做 CICD。單看 Github Actions 可能不知道是啥。其實它就是我們常說的 CICD pipeline 或者叫 workflow。當我們 Push 代碼到 Github,它會自動觸發這些管道。它會幫我們自動 build 代碼,跑 test cases,構建鏡像,發布鏡像,等等。這一切還都是免費的。
今天我把 AgileConfig 的測試在 Github Actions 上跑通了。原來集成測試在 Actions 上跑一直有點問題,今天終于修好了。既然 test cases 都可以跑通了,那么能不能在 Actions 直接看到 code coverage 呢?答案當然是肯定的。
運行測試并收集結果
在我們每次運行單元測試的時候,微軟的工具其實已經可以為我們生成結果描述文件了。請使用以下代碼運行測試:
dotnet test --no-build --verbosity normal --collect:"XPlat Code Coverage" --results-directory ./coverage
運行完成后我們可以看到會生成多個 xml 文件,這些文件其實就是用來描述測試內容與結果的文件.
測試運行成功。
測試總數: 123
     通過數: 123
總時間: 2.6757 分鐘
     1>已完成生成項目“D:\00WORKSPACE\AgileConfig\AgileConfig.sln”(VSTest 個目標)的操作。

已成功生成。
    0 個警告
    0 個錯誤

已用時間 00:02:43.08

附件:
  D:\00WORKSPACE\AgileConfig\coverage\1a7564b1-aa53-44ad-b34b-9abbb4b97c9f\coverage.cobertura.xml
  D:\00WORKSPACE\AgileConfig\coverage\45f571fb-2ec4-445b-b444-6879f784c925\coverage.cobertura.xml
  D:\00WORKSPACE\AgileConfig\coverage\ff1d49a5-9663-42f9-813b-2ef81fe5ed3f\coverage.cobertura.xml
  D:\00WORKSPACE\AgileConfig\coverage\6b502f8f-a99f-4931-8643-faf79db7273c\coverage.cobertura.xml
  D:\00WORKSPACE\AgileConfig\coverage\ff389298-7b68-4e60-a35c-d9c0db8cd640\coverage.cobertura.xml
在本地分析測試結果
有了這幾個 xml 文件我們就可以進行分析了。當然用肉眼來分析是看不出來啥的。我們先在本地用插件來分析一波。
在 VS 里安裝插件:
Fine Code Coverage
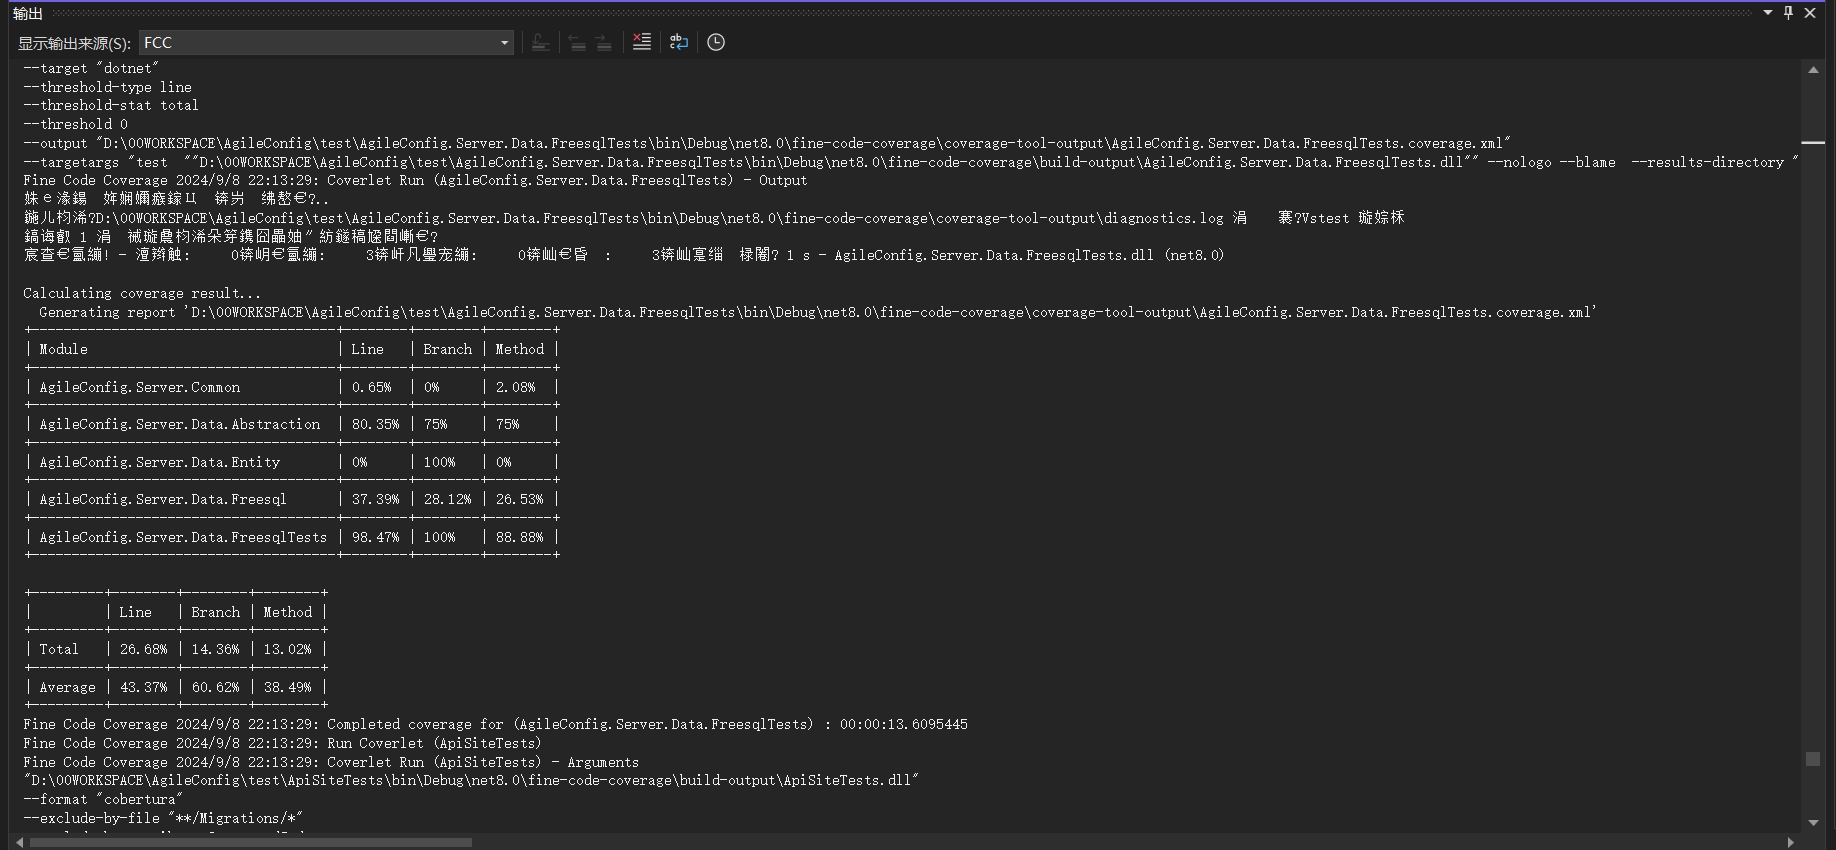
安裝完后插件后,再次運行一下所有的測試用例。在 VS 的輸出窗口我們選擇 FCC 。
這個窗口內會打印出每個 project 的測試結果。
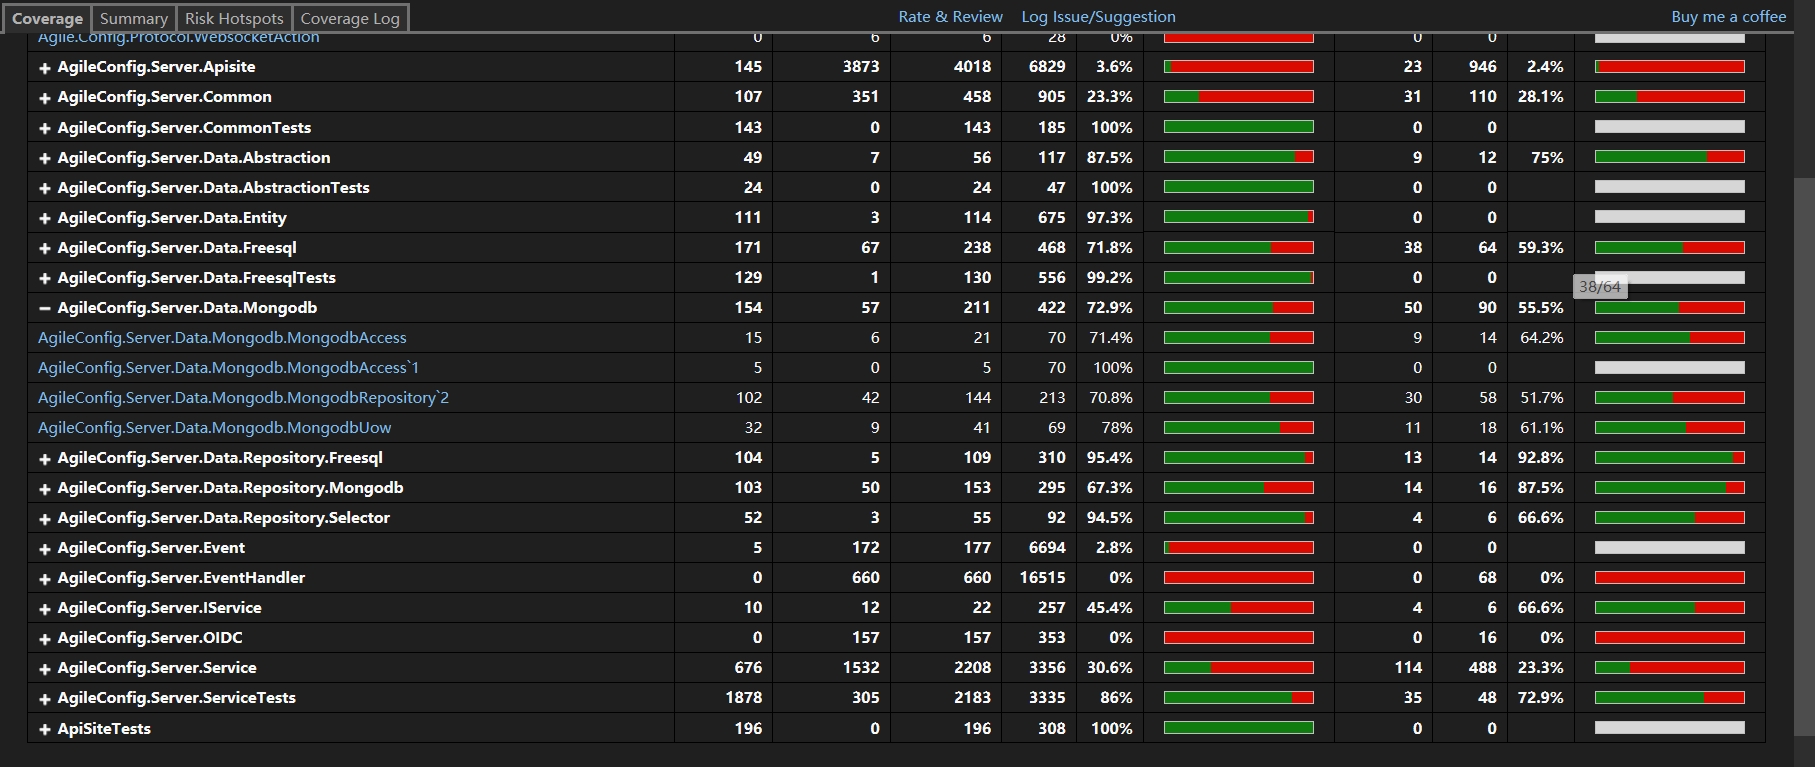
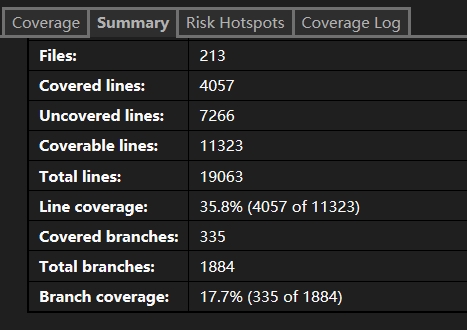
打開 “視圖”>“其他窗口”>“Fine code coverage” ,我們能查看更詳細的結果。
使用 CodeCoverageSummary
既然在本地能分析這些文件,那么我們顯然只要能在 Github Actions 里面插入一步分析的步驟就可以了。顯然已經有大佬實現了這個 Action,我們只要集成到自己的 workflow 文件里就行了。
CodeCoverageSummary:
A GitHub Action that reads Cobertura format code coverage files from your test suite and outputs a text or markdown summary. This summary can be posted as a Pull Request comment or included in Release Notes by other actions to give you an immediate insight into the health of your code without using a third-party site.
修改我們的 CI Workflow 文件:
  - name: Build
      run: dotnet build --no-restore
    - name: Test
      run: dotnet test --no-build --verbosity normal --collect:"XPlat Code Coverage" --results-directory ./coverage
    - name: Code Coverage Report
      uses: irongut/CodeCoverageSummary@v1.3.0
      with:
        filename: coverage/**/coverage.cobertura.xml
        badge: true
        fail_below_min: true
        format: markdown
        hide_branch_rate: false
        hide_complexity: true
        indicators: true
        output: both
        thresholds: '60 80'
使用起來非常簡單。并且有非常多的配置項,這里不一一介紹了。有需要的直接看它的文檔吧。
下面讓我們跑一下這個 workflow 試試看。
Coverage File: /github/workspace/coverage/d497ebaf-5670-41ea-8215-dfb4f3a037d6/coverage.cobertura.xml
Coverage File: /github/workspace/coverage/83632b7c-8df2-4179-b0a8-e6410a71b1b7/coverage.cobertura.xml
Coverage File: /github/workspace/coverage/b434d3bb-7909-4a7d-b0f2-f8620d429cfc/coverage.cobertura.xml
Coverage File: /github/workspace/coverage/af81da37-b5c5-4edd-a409-74984355857e/coverage.cobertura.xml
Coverage File: /github/workspace/coverage/1b159b39-3eb4-4951-936e-afde68925b34/coverage.cobertura.xml

Package | Line Rate | Branch Rate | Health
-------- | --------- | ----------- | ------
AgileConfig.Server.IService | 41% | 67% | ?
Agile.Config.Protocol | 0% | 100% | ?
AgileConfig.Server.Data.Repository.Freesql | 95% | 93% | ?
AgileConfig.Server.Data.Freesql | 72% | 59% | ?
AgileConfig.Server.Service | 28% | 21% | ?
AgileConfig.Server.EventHandler | 0% | 0% | ?
AgileConfig.Server.Data.Mongodb | 73% | 54% | ?
AgileConfig.Server.Data.Abstraction | 77% | 50% | ?
AgileConfig.Server.Event | 0% | 100% | ?
AgileConfig.Server.Data.Repository.Mongodb | 67% | 88% | ?
AgileConfig.Server.Data.Entity | 97% | 100% | ?
AgileConfig.Server.Common | 1% | 0% | ?
AgileConfig.Server.Data.Repository.Selector | 95% | 67% | ?
AgileConfig.Server.Data.Freesql | 45% | 31% | ?
AgileConfig.Server.Data.Abstraction | 80% | 75% | ?
AgileConfig.Server.Data.Entity | 89% | 100% | ?
AgileConfig.Server.Common | 1% | 0% | ?
AgileConfig.Server.Data.Abstraction | 77% | 67% | ?
AgileConfig.Server.Data.Entity | 0% | 100% | ?
AgileConfig.Server.Common | 1% | 0% | ?
AgileConfig.Server.Common | 21% | 25% | ?
AgileConfig.Server.IService | 27% | 17% | ?
Agile.Config.Protocol | 0% | 100% | ?
AgileConfig.Server.Data.Repository.Freesql | 0% | 0% | ?
AgileConfig.Server.Data.Freesql | 0% | 0% | ?
AgileConfig.Server.Service | 2% | 2% | ?
AgileConfig.Server.EventHandler | 0% | 0% | ?
AgileConfig.Server.Data.Mongodb | 0% | 0% | ?
AgileConfig.Server.Data.Abstraction | 0% | 0% | ?
AgileConfig.Server.Event | 3% | 100% | ?
AgileConfig.Server.Data.Repository.Mongodb | 0% | 0% | ?
AgileConfig.Server.Data.Entity | 15% | 100% | ?
AgileConfig.Server.OIDC | 0% | 0% | ?
AgileConfig.Server.Common | 2% | 3% | ?
AgileConfig.Server.Data.Repository.Selector | 0% | 0% | ?
AgileConfig.Server.Apisite | 4% | 2% | ?
**Summary** | **18%** (2009 / 15061) | **15%** (337 / 3196) | ?
_Minimum allowed line rate is `60%`_
FAIL: Overall line rate below minimum threshold of 60%.
我們發現這個 workflow 跑失敗了。原因是我們的 coverage 只有 18%。剛才我們配置了最小值是 60%,低于60就會直接跑出異常,中斷 workflow。看日志我們也可以看到對每一個項目的統計。有 line rate,branch rate,health 等內容。
總結
這次我們演示了如何在本地使用 VS 插件對單元測試的結果進行分析獲得 coverage。以及演示了如何通過 CodeCoverageSummary 在 Github Action 的 workflow 內對測試結果進行分析。還是非常簡單的。希望對大家有幫助。
好了不說了,補單元測試去了。。。
關注我的公眾號一起玩轉技術

QQ群:1022985150 VX:kklldog 一起探討學習.NET技術
作者:Agile.Zhou(kklldog)
出處:http://www.rzrgm.cn/kklldog/
本文版權歸作者和博客園共有,歡迎轉載,但未經作者同意必須保留此段聲明,且在文章頁面明顯位置給出原文連接,否則保留追究法律責任的權利。

 浙公網安備 33010602011771號