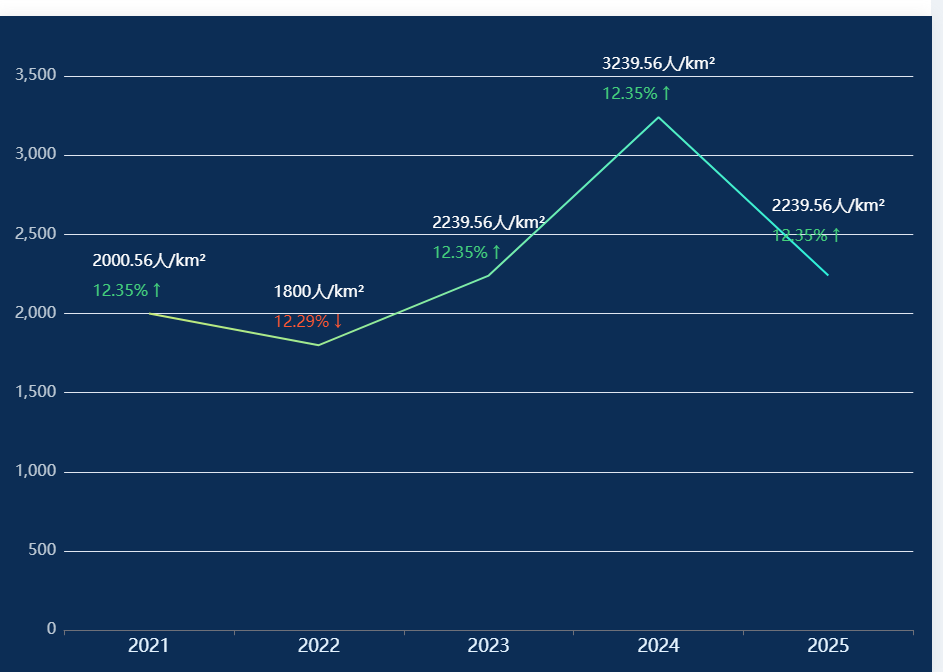
echart圖表折線圖
var cdata=[
    2000.56,
    1800,
    2239.56,
    3239.56,
    2239.56
]

let lineColor=['#C5E879', '#2DF0DB']

let cxdata=[2021,2022,2023,2024,2025]


// 增長率數(shù)據(jù),正數(shù)為增長(↑),負數(shù)為下降(↓),實際根據(jù)計算得到
        // var growthRates = [12.35, -12.29, 12.35, 12.35, 12.35];
        var growthRates =  [12.35, -12.29, 12.35, 12.35, 12.35];
        // 處理數(shù)據(jù),用于標注顯示(拼接數(shù)值和增長率)
        var labelData = cdata.map((val, index) => {
          let growthSymbol = growthRates[index] >= 0 ? '↑' : '↓';
          let str = "";
          if (growthRates[index] >= 0) { // 增長
            str = `{value1|${val}人/km2}\n{value2|${Math.abs(growthRates[index])}% ${growthSymbol}}`
          } else {
            str = `{value1|${val}人/km2}\n{value3|${Math.abs(growthRates[index])}% ${growthSymbol}}`
          }
          return str;
        });
        // 顏色漸變
        const createGradient = (color1, color2) => {
          return new echarts.graphic.LinearGradient(0, 0, 1, 0, [
            { offset: 0, color: color1 },
            { offset: 1, color: color2 }
          ]);
        };

        // 處理最后一個數(shù)據(jù)顯示圓圈
        const processData = (data, markerImage, length) => {
          return data.map((value, index) => {
            // 檢查是否為最后一個數(shù)據(jù)點
            if (index === length - 1) {
              return {
                value: value,
                symbol: `image://${markerImage}`,
                symbolSize: [47, 38],
                symbolOffset: [0, 0]
              };
            }
            return value;
          });
        };
        const processDataFormat = processData(cdata, '', cdata.length)

        option = {
           backgroundColor: '#0c2d55',
          title: {
            // text: '', // 可根據(jù)需求設(shè)置標題
            // left: 'center'
          },
          tooltip: {
            trigger: 'axis',
            axisPointer: {
              type: 'shadow',
              shadowStyle: {
                color: 'rgba(255, 255, 255, 0.1)'
              }
            },
            backgroundColor: 'rgba(18, 28, 40, 0.9)',
            borderColor: 'rgba(255, 255, 255, 0.1)',
            borderWidth: 1,
            textStyle: {
              color: '#E4F3FF'
            },
            // formatter: function (params) {
            //     let item = params[0];
            //     let growthSymbol = growthRates[item.dataIndex] >= 0 ? '↑' : '↓';
            //     return `${this.cxdata[item.dataIndex]}<br/>${item.seriesName}: ${item.value}人/㎡<br/>增長率: ${Math.abs(growthRates[item.dataIndex])}% ${growthSymbol}`;
            // }
          },
          xAxis: {
            type: 'category',
            data: cxdata,
            axisLabel: {
              fontSize: 18,
              fontFamily: "Source Han Sans",
              color: '#E4F3FF' // 可選:設(shè)置字體顏色
            }
          },
          yAxis: {
            type: 'value',
            axisTick: { show: false },
            axisLine: { show: false },
            axisLabel: {
              fontSize: 16,
              fontFamily: "Source Han Sans",
              color: '#BCC8D4' // 可選:設(shè)置字體顏色
            }
          },
          grid: {
            left: '2%',
            right: '2%',
            bottom: '3%',
            containLabel: true
          },
          series: [
            {
              name: '青年人口密度',
              type: 'line',
              data: processDataFormat,
              lineStyle: {
                color: createGradient(lineColor[0], lineColor[1]), // 折線顏色,類似示例中的紅色
              },
              symbol: 'circle',  // 隱藏拐點圓
              smooth: false,
              // symbolSize: 6, // 必須設(shè)置大小,確保標簽有定位基準
              itemStyle: {
                color: 'rgba(76, 175, 80, 0)', // 拐點顏色
                borderWidth: 0
              },
              label: {
                show: true,
                ignore: true,
                position: 'top', // 標注位置,可根據(jù)需求調(diào)整為 'bottom' 等
                formatter: function (params) {
                  return labelData[params.dataIndex];
                },
                rich: { // 定義文本顏色
                  value1: {
                    color: '#fff',
                    fontSize: 16,
                    // marginBottom: 5
                  },
                  value2: {
                    color: '#43CF7C',
                    fontSize: 16
                  },
                  value3: {
                    color: '#FF5733',
                    fontSize: 16
                  },
                },
                lineHeight: 30
              },

            }
          ],
        };
效果圖:


 浙公網(wǎng)安備 33010602011771號