
SpringBootWeb服務的指標監控-Prometheus與Grafana實現
使用prometheus收集springboot webapp的指標, 由grafana進行圖形化展示.
Prometheus 是一個開源的監控和警報工具,旨在提供可靠的實時監控,具有高度可擴展性和靈活性。它采用了基于拉取的模型,通過在目標上暴露自身的 HTTP API,由 Prometheus 服務器定期拉取指標數據。
簡單來說, Prometheus 主要監控系統性能。
Grafana是一個流行的開源數據可視化工具,專注于實時監控和儀表盤展示。它支持多種數據源,如Prometheus、Graphite、InfluxDB等,可以將各種數據源的指標進行可視化展示,幫助用戶實時了解系統運行狀態。
簡單來說, Grafana 主要實現系統監控可視化。
環境
windows WSL + ubuntu 22.04
java 17
Prometheus 3.7.1
Grafana 12.2.1
被監控的webserver
webserver上需要集成prometheus的探針, 示例見:
一個簡單的基于springboot的webserver
application.properties配置
spring.application.name=spring-webserver-prometheus

# 管理端點的根路徑,默認就是/actuator
# management.endpoints.web.base-path=/actuator
# 管理端點的端口.默認和server.port相同
management.server.port=10002
# http指標監控. http://localhost:6090/actuator/metrics/http.server.requests
# prometheus的路徑是/actuator/prometheus
management.endpoints.web.exposure.include=health,metrics,info,prometheus
  # 啟用 prometheus 端口,默認就是true
management.metrics.export.prometheus.enabled=true
  # 增加每個指標的全局的tag
management.metrics.tags.application=${spring.application.name}
pom.xml
<!-- Actuator提供監控端點 -->
<dependency>
    <groupId>org.springframework.boot</groupId>
    <artifactId>spring-boot-starter-actuator</artifactId>
</dependency>

<!-- Micrometer Prometheus注冊表 -->
<!--
注意!這里沒寫版本是因為默認使用spring-boot-starter-parent中定義好的版本.
如果不使用spring-boot-starter-parent,則需要自行試驗兼容的版本.
不要使用最新版本就對了,永遠使用穩定版本!
 -->
<dependency>
    <groupId>io.micrometer</groupId>
    <artifactId>micrometer-registry-prometheus</artifactId>
</dependency>
Prometheus
tar xvfz prometheus-*.tar.gz
cd prometheus-*
配置
添加springboot應用的監控配置
scrape_configs:
  - job_name: 'spring-boot-app'
    metrics_path: '/actuator/prometheus'
    scrape_interval: 15s
    static_configs:
      - targets: ['yourIP:10002']
        labels:
          application: 'spring-webserver-prometheus'
targets替換為應用ip和管理端口.注意如果是WSL,最好不要使用localhost
application替換為spring應用名稱
啟動
./prometheus --config.file=prometheus.yml
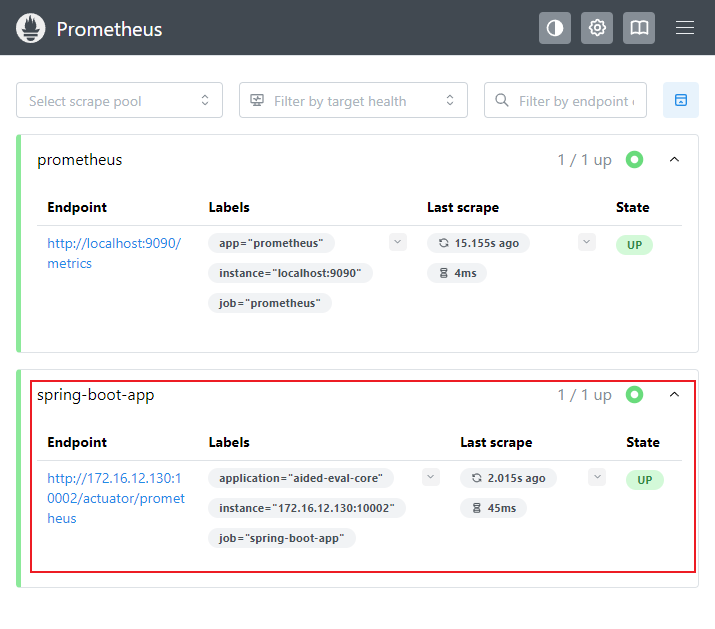
打開瀏覽器, 通過localhost:9090可訪問其WebUI.
在頁面http://localhost:9090/targets中應該可以看到配置的web服務.
Grafana
安裝
sudo apt-get install -y adduser libfontconfig1 musl
wget https://dl.grafana.com/grafana/release/12.2.1/grafana_12.2.1_18655849634_linux_amd64.deb
sudo dpkg -i grafana_12.2.1_18655849634_linux_amd64.deb
啟動
sudo /bin/systemctl start grafana-server
由于我是在WSL中使用,因此手動啟動
cd /usr/share/grafana/bin
sudo ./grafana server
如有需要,可以配置開機自啟
 sudo /bin/systemctl daemon-reload
 sudo /bin/systemctl enable grafana-server
訪問
打開瀏覽器, 訪問http://localhost:3000
默認賬號密碼: admin/admin
配置
配置Grafana數據源指向Prometheus,然后可以導入Spring Boot儀表板
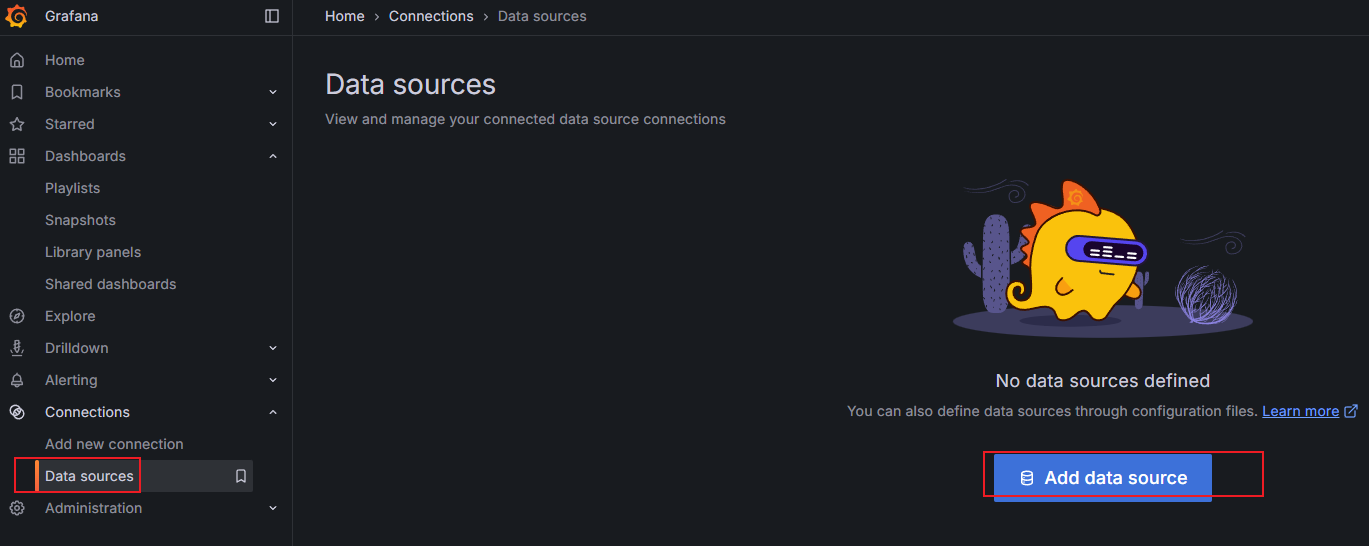
Prometheus配置數據源
第一步
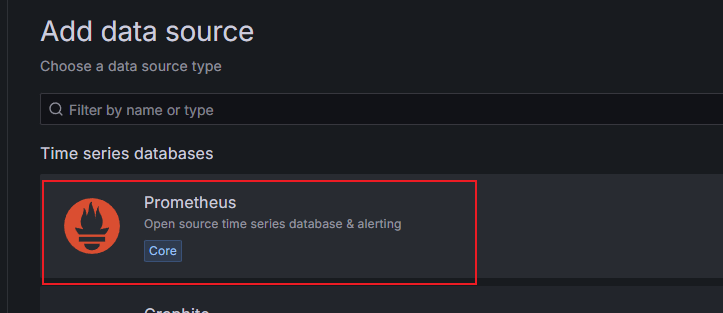
第二步
第一步,在url中填寫Prometheus配置數據源的默認URL: http://localhost:9090
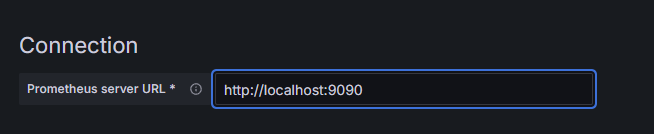
滾動到頁面最下面, save. 如果test通過,則開始添加dashboard.

配置大屏
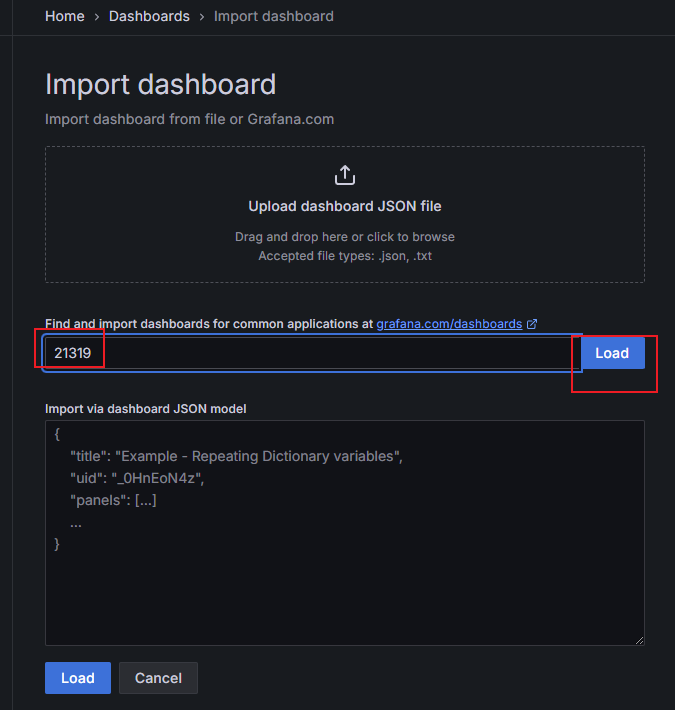
自己配置很煩, 社區提供了很多現成的模板.可以通過id導入.
11378和21319比較好.
也可以自己去社區找
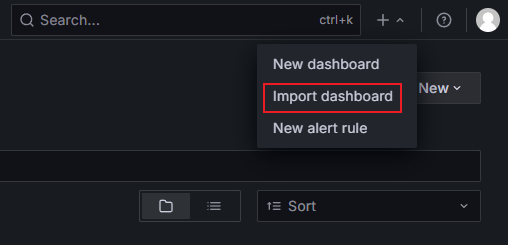
步驟一
步驟二
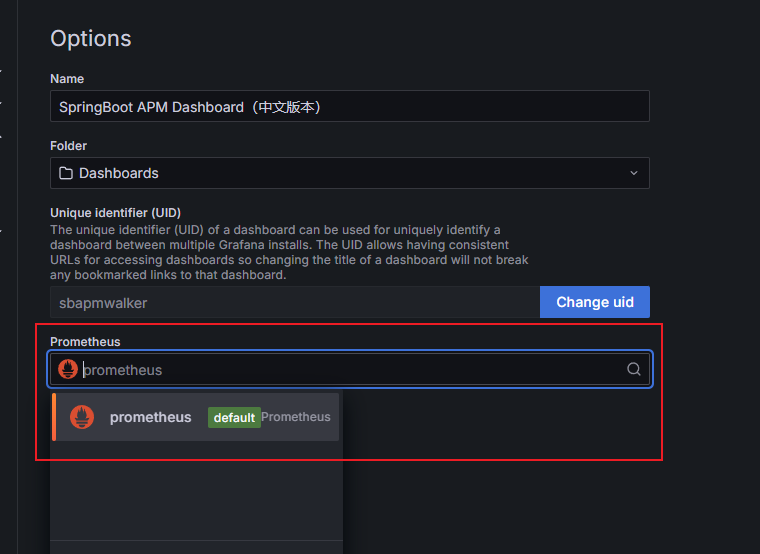
步驟三,注意選擇前面配置好的數據源.
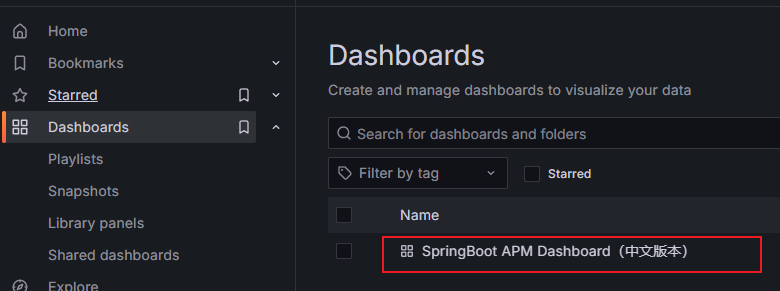
這是大屏效果.

大屏的位置

 浙公網安備 33010602011771號