如何用隨機方法求解組合優化問題(七)
模擬退火算法應用舉例
這是一篇筆記,是對于B站up主馬少平的視頻(第四篇 如何用隨機方法求解組合優化問題(七))的學習與記錄。
旅行商問題
一個商人要訪問 \(n\) 個城市,每個城市訪問一次,并且只能訪問一次,最后再回到出發城市。
問如何規劃才能使得行走的路徑長度最短。
旅行商問題的解空間非常大,難以使用窮舉法進行求解。
- 10城市:\(10!=3628800\)
- 20城市:\(20!\approx 2.43\times 10^{18}\)
在已知模擬退火算法的基本框架,以及需要確定的參數的情況下,為了解決實際問題,我們需要將實際問題,轉換并抽離出我們需要的參數。
指標函數
其中 \((\pi_1,\cdots,\pi_n)\) 是表示路徑的序列,\(\pi_i\) 表示第 \(i\) 個訪問的城市,\(d_{\pi_i\pi_i+1}\) 是路徑中相鄰兩個城市的距離。
新解的產生
逆序交換法
- 當前解
- 交換后
即 \(\pi_u\) 和 \(\pi_v\) 這兩個城市之間的路徑進行逆序, \(\pi_u\) 和 \(\pi_v\) 不變。
指標函數差
當新解是較好的解時,百分之百接受;當新解是較差的解時,則按概率接受:
為了計算接受概率,需要先計算指標函數差 \(f(j)-f(i)\)。
需要注意的是,這里并不需要完全計算出兩個解的總路徑長度再做差。
由于我們使用的是逆序交換法,兩個解之間的差別只存在于逆序區間的交界處。
當前解:\((\pi_1,\cdots,\pi_u,\pi_{u+1},\cdots,\pi_{v-1},\pi_v,\cdots,\pi_n)\)
交換后:\((\pi_1,\cdots,\pi_u,\pi_{v-1},\cdots,\pi_{u+1},\pi_v,\cdots,\pi_n)\)
因此,有:
故從解 \(i\) 到解 \(j\) 的接受概率:
參數確定
- 初始溫度:\(t_0=200\)
- 溫度衰減系數:\(\alpha=0.95\),\(t_{k+1}=\alpha t_k\)
- 每個溫度下的迭代次數:\(100n\),\(n\) 為城市數
- 算法結束條件:無變化控制法(相鄰兩個溫度下結果相等)
代碼實現
測試數據
這里提供了 10 個城市的 xy 坐標。
A 0.4000 0.4439
B 0.2439 0.1463
C 0.1707 0.2293
D 0.2293 0.7610
E 0.5171 0.9414
F 0.8732 0.6536
G 0.6878 0.5219
H 0.8488 0.3609
I 0.6683 0.2536
J 0.6195 0.2634
City class
定義 City 類,方便后續操作。
class City:
    def __init__(self, name: str, x: float, y: float):
        self.name = name
        self.x = x
        self.y = y

    def __repr__(self):
        return f"{self.name} {self.x} {self.y}"

    def __str__(self):
        return f"{self.name} {self.x} {self.y}"

    def distance(self, other: 'City'):
        d = ((self.x - other.x)*(self.x - other.x)
             + (self.y - other.y)*(self.y - other.y))**0.5
        return d
讀取數據
假設上面的測試數據保存在10.txt文件中。這里用一個函數來讀取文件數據,并轉換為 City 列表。
def read_data(path: str):
    data: list[City] = []
    with open(path, 'r', encoding='utf-8') as f:
        for line in f.readlines():
            information = line.replace('\n', '').split(' ')
            data.append(City(name=information[0], x=float(information[1]), y=float(information[2])))
    return data
生成隨機序列
為了隨機地生成一個初始解,使用一個數值列表表示旅行商的城市訪問順序:
def gen_random_seq(length: int)->list[int]:
    sequence = list(range(length))
    random.shuffle(sequence)
    return sequence
實現對序列片段的逆序交換
為了生成鄰居解,需要實現逆序交換,函數需要傳入:原序列、逆序區間的起始下標、結束下標。
def reverse_seq(sequence: list[int], start_idx: int, end_idx: int)->list[int]:
    assert start_idx <= end_idx
    i = start_idx
    j = end_idx
    while i<j:
        sequence[i], sequence[j] = sequence[j], sequence[i]
        i += 1
        j -= 1
    return sequence
生成鄰居解
根據傳入的原序列,使用逆序交換法生成鄰居解,逆序區間是隨機的。
這里生成兩個端點a,b之后,進行逆序,但是逆序操作并不包含這兩個端點。
因為類似于[0,...,9]和[9,...,0]這兩個序列在旅行商問題中是一樣的,路線是首尾相接的環。
def gen_near_seq(sequence:list[int])->(list[int], int, int):
    n = len(sequence)
    a = math.floor(random.random()*n)
    b = math.floor(random.random()*n)
    start_idx, end_idx = (a, b) if a<b else (b, a)
    # 除去區間端點
    if end_idx - start_idx > 1:
        start_idx += 1
        end_idx -= 1
    return reverse_seq(sequence, start_idx, end_idx), start_idx, end_idx
指標函數
根據序列和城市列表,計算路徑的總長度。
def valuate(sequence: list[int], cities: list[City])->float:
    total: float = 0
    length = len(cities)
    for idx in range(length):
        curr_city = cities[sequence[idx]]
        next_city = cities[sequence[(idx+1)%length]]
        d = curr_city.distance(next_city)
        total += d
    return total
最終實現
根據上面已經編寫好的函數,開始結合算法解決問題。
數據讀取
# 文件的路徑根據實際情況進行填寫
cities = read_data('./dataset/10.txt')
超參數設置
# 初始溫度
t = 200
# 溫度遞減速率
alpha = 0.95
# 問題規模(10個城市)
n = 10
# 同一溫度的迭代次數
iteration_times = 100 * n
生成隨機序列
隨機地生成當前的序列和它的指標:curr_seq和curr_val;
初始化最優解的序列和指標:best_seq和best_val.
curr_seq: list[int] = gen_random_seq(n)
curr_val: float = valuate(curr_seq, cities)
best_seq: list[int] = list()
best_val: float = float('inf')
內外循環
while curr_val != best_val:
    i = 0
    while i < iteration_times:
        i += 1
        # 生成相鄰解
        new_seq, start_idx, end_idx = gen_near_seq(curr_seq)
        new_val = valuate(new_seq, cities)
        # 是否接受解
        if new_val <= curr_val:
            curr_seq, curr_val = new_seq, new_val
        else:
            if random.random() < math.e ** ((curr_val - new_val) / t):
                curr_seq, curr_val = new_seq, new_val
        # 記錄當前溫度的最優解
        if curr_val < best_val:
            best_seq, best_val = curr_seq, curr_val
    t *= alpha
運行結果與相關圖像
上述 10 個城市的案例,最終結果為
best_val: 2.6906706370094136
通過在上面代碼的循環中嵌入“導出數據到csv文件”的操作(這里沒有給出代碼),然后結合pandas和matplotlib等庫,可以繪制出下面圖像:
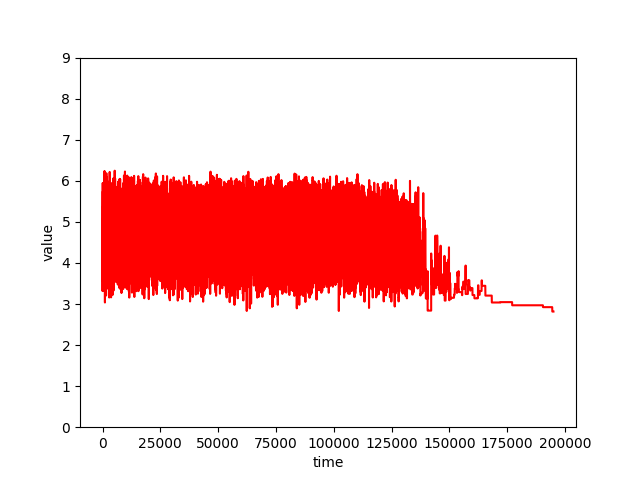
這個圖像的橫坐標是迭代次數,縱坐標是指標(即路徑長度)。
上圖的橫坐標數據中,每一個溫度記錄10000個數據,直到最終滿足外循環的結束條件。
可以看到,隨著溫度的下降,波動在變小,并最終收斂到最優解。
前段區間的波動一致,是因為指標本身存在上下界,即十個城市的坐標確認后,最優解和最差解是固定的。
通過減少數據導出頻率(提高運行速度),并且將溫度的數值進行等比例縮小。將溫度和指標繪制到下面這幅圖:
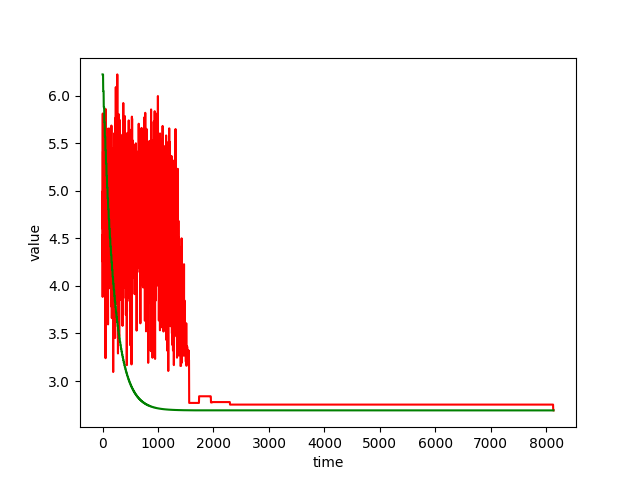
可以更直觀地看出溫度和指標波動的關系。

 浙公網安備 33010602011771號