
PLT繪圖
1、繪制不同顏色的點(diǎn)(二維)
import matplotlib.pyplot as plt
if __name__ == '__main__':
# 準(zhǔn)備數(shù)據(jù)
x = [1, 2, 3, 4, 5] # X軸上的點(diǎn)
y = [1, 4, 9, 16, 25] # Y軸上的點(diǎn),這里以x的平方為例
colors = ['red', 'green', 'blue', 'yellow', 'purple'] # 點(diǎn)的顏色列表
# 繪制點(diǎn)
for i in range(len(x)):
plt.scatter(x[i], y[i], color=colors[i]) # 使用scatter函數(shù)繪制點(diǎn),并指定顏色
# 添加標(biāo)題和坐標(biāo)軸標(biāo)簽
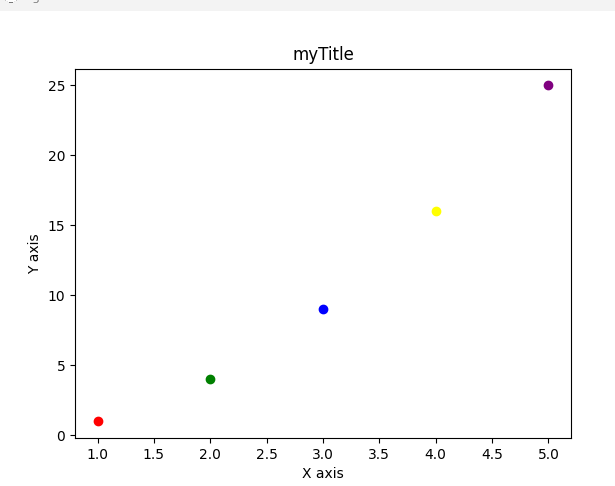
plt.title('myTitle')
plt.xlabel('X axis')
plt.ylabel('Y axis')
# 顯示圖形
plt.show()
效果:
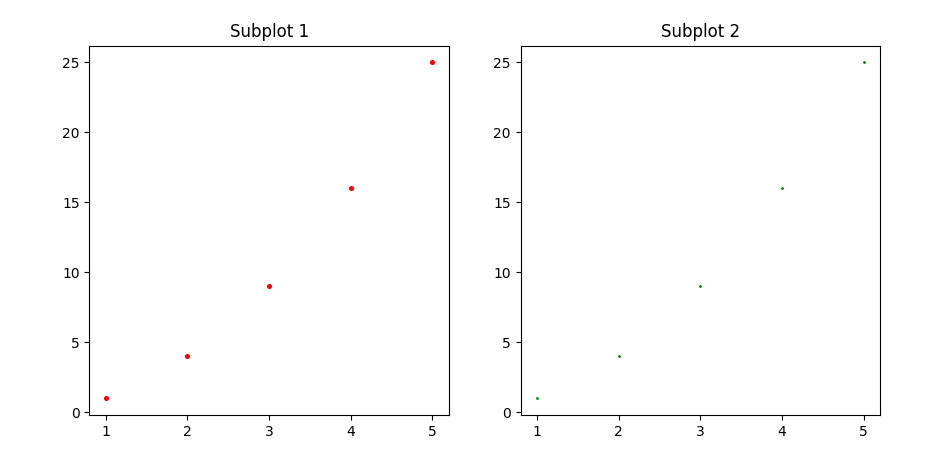
還可以繪制多個(gè)畫布:
import matplotlib.pyplot as plt

if __name__ == '__main__':
    # 準(zhǔn)備數(shù)據(jù)
    x = [1, 2, 3, 4, 5]  # X軸上的點(diǎn)
    y = [1, 4, 9, 16, 25]  # Y軸上的點(diǎn),這里以x的平方為例
    colors = ['red', 'green', 'blue', 'yellow', 'purple']  # 點(diǎn)的顏色列表

    fig = plt.figure()  # 創(chuàng)建一個(gè)圖形畫布,可以增加子圖形

    ax1 = fig.add_subplot(1, 2, 1)  # 1行2列,第1個(gè)位置
    ax1.set_title('Subplot 1')
    ax1.scatter(x,y, s=7, c='red')  # 繪制點(diǎn);s表示點(diǎn)的大小

    ax2 = fig.add_subplot(1, 2, 2)  # 1行2列,第2個(gè)位置
    ax2.set_title('Subplot 2')
    ax2.scatter(x, y, s=1, c='green')  # 繪制點(diǎn);s表示點(diǎn)的大小

    # 顯示圖形
    plt.show()

 浙公網(wǎng)安備 33010602011771號(hào)