
node-red使用echart
node-red使用echart
官網(wǎng)下載echart.js
查找Node-red的settings.js文件
方法一
登陸服務(wù)器,啟動(dòng)node-red。
$ node-red
3 Nov 20:22:38 - [info]

Welcome to Node-RED
===================

3 Nov 20:22:38 - [info] Node-RED version: v4.0.3
3 Nov 20:22:38 - [info] Node.js  version: v20.17.0
3 Nov 20:22:38 - [info] Linux 5.15.0-117-generic x64 LE
3 Nov 20:22:38 - [info] Loading palette nodes
3 Nov 20:22:41 - [info] Dashboard version 1.0.2 started at /ui
......
- /usr/local/lib/node_modules/node-red/node_modules/@node-red/registry/lib/loader.js
- /usr/local/lib/node_modules/node-red/node_modules/@node-red/registry/lib/index.js
- /usr/local/lib/node_modules/node-red/node_modules/@node-red/runtime/lib/nodes/index.js
- /usr/local/lib/node_modules/nodegwyy23c1-red/node_modules/@node-red/runtime/lib/index.js
- /usr/local/lib/node_modules/node-red/lib/red.js
- /usr/local/lib/node_modules/node-red/red.js
3 Nov 20:22:44 - [warn] ------------------------------------------------------
3 Nov 20:22:44 - [info] Settings file  : /home/usr/.node-red/settings.js
方法二
通過(guò)node-red --print settings查找
$ node-red --print settings
3 Nov 20:30:08 - [info]

Welcome to Node-RED
===================

3 Nov 20:30:08 - [info] Node-RED version: v4.0.3
3 Nov 20:30:08 - [info] Node.js  version: v20.17.0
3 Nov 20:30:08 - [info] Linux 5.15.0-117-generic x64 LE
3 Nov 20:30:08 - [info] Loading palette nodes
3 Nov 20:30:08 - [info] Dashboard version 1.0.2 started at /ui
......
Require stack:
- /home/usr/.node-red/node_modules/@emanuel_miron/node-red-email/email.js
- /usr/local/lib/node_modules/node-red/node_modules/@node-red/registry/lib/loader.js
- /usr/local/lib/node_modules/node-red/node_modules/@node-red/registry/lib/index.js
- /usr/local/lib/node_modules/node-red/node_modules/@node-red/runtime/lib/nodes/index.js
- /usr/local/lib/node_modules/node-red/node_modules/@node-red/runtime/lib/index.js
- /usr/local/lib/node_modules/node-red/lib/red.js
- /usr/local/lib/node_modules/node-red/red.js
3 Nov 20:30:10 - [warn] ------------------------------------------------------
3 Nov 20:30:10 - [info] Settings file  : /home/usr/.node-red/settings.js
修改settings.js文件
檢索httpStatic配置
根據(jù)配置文件的目錄,一級(jí)級(jí)往下找,找到httpStatic
 * The settings are split into the following sections:
 *  - Flow File and User Directory Settings
 *  - Security
 *  - Server Settings
 *  - Runtime Settings
 *  - Editor Settings
 *  - Node Settings
......
/*******************************************************************************
 * Server Settings
 *  - uiPort
 *  - uiHost
 *  - apiMaxLength
 *  - httpServerOptions
 *  - httpAdminRoot
 *  - httpAdminMiddleware
 *  - httpAdminCookieOptions
 *  - httpNodeRoot
 *  - httpNodeCors
 *  - httpNodeMiddleware
 *  - httpStatic
 *  - httpStaticRoot
 *  - httpStaticCors
 ******************************************************************************/
......
 /** When httpAdminRoot is used to move the UI to a different root path, the
     * following property can be used to identify a directory of static content
     * that should be served at http://localhost:1880/.
     * When httpStaticRoot is set differently to httpAdminRoot, there is no need
     * to move httpAdminRoot
     */
   //httpStatic: '/home/nol/node-red-static/', //single static source
去掉注釋?zhuān)股В瑫r(shí),可以根據(jù)實(shí)際情況修改路徑。
httpStatic: '/home/nol/node-red-static/', //single static source
可以改成這樣,然后把echart.js丟到這個(gè)路徑下面(文件夾里)
重啟nodered使配置生效
sudo systemctl restart nodered
復(fù)制粘貼echart的樣例html代碼
<!DOCTYPE html>
<html>
<head>
<meta charset="utf-8" />
<title>ECharts</title>
<!-- 引入剛剛下載的 ECharts 文件 -->
<script src="echarts.js"></script>
</head>
<body>
<!-- 為 ECharts 準(zhǔn)備一個(gè)定義了寬高的 DOM -->
<div id="main" style="width: 600px;height:400px;"></div>
<script type="text/javascript">
// 基于準(zhǔn)備好的dom,初始化echarts實(shí)例
var myChart = echarts.init(document.getElementById('main'));
// 指定圖表的配置項(xiàng)和數(shù)據(jù)
var option = {
title: {
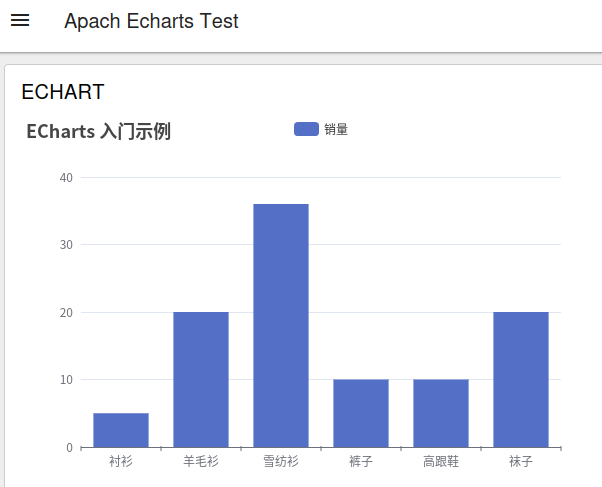
text: 'ECharts 入門(mén)示例'
},
tooltip: {},
legend: {
data: ['銷(xiāo)量']
},
xAxis: {
data: ['襯衫', '羊毛衫', '雪紡衫', '褲子', '高跟鞋', '襪子']
},
yAxis: {},
series: [
{
name: '銷(xiāo)量',
type: 'bar',
data: [5, 20, 36, 10, 10, 20]
}
]
};
// 使用剛指定的配置項(xiàng)和數(shù)據(jù)顯示圖表。
myChart.setOption(option);
</script>
</body>
</html>
丟到node-red的template節(jié)點(diǎn)里。
apply,發(fā)現(xiàn),一片白。
查看發(fā)現(xiàn),echart.js無(wú)法正常加載。
繼續(xù)修改template代碼。
<template>
  <div>
    <!-- 為 ECharts 準(zhǔn)備一個(gè)定義了寬高的 DOM -->
    <div id="main" style="width: 600px; height: 400px;"></div>
  </div>
</template>

<script>
export default {
  mounted() {
    // 動(dòng)態(tài)創(chuàng)建 script 標(biāo)簽
    const echartsScript = document.createElement('script');
    echartsScript.src = '/echarts.js';
    echartsScript.async = true;
    echartsScript.onload = () => {
      try {
        // 確保 echarts.js 加載完成后再初始化 echarts
        const echarts = window.echarts;

        // 基于準(zhǔn)備好的 dom,初始化 echarts 實(shí)例
        var myChart = echarts.init(document.getElementById('main'));

        // 指定圖表的配置項(xiàng)和數(shù)據(jù)
        var option = {
          title: {
            text: 'ECharts 入門(mén)示例'
          },
          tooltip: {},
          legend: {
            data: ['銷(xiāo)量']
          },
          xAxis: {
            data: ['襯衫', '羊毛衫', '雪紡衫', '褲子', '高跟鞋', '襪子']
          },
          yAxis: {},
          series: [
            {
              name: '銷(xiāo)量',
              type: 'bar',
              data: [5, 20, 36, 10, 10, 20]
            }
          ]
        };

        // 使用剛指定的配置項(xiàng)和數(shù)據(jù)顯示圖表。
        myChart.setOption(option);
        console.log("ECharts chart rendered successfully");
      } catch (error) {
        console.error("Error initializing or rendering ECharts:", error);
      }
    };
    document.head.appendChild(echartsScript);
  }
}
</script>

<style>
/* define any styles here - supports raw CSS */
#main {
  width: 600px;
  height: 400px;
}
</style>
測(cè)試
在這個(gè)過(guò)程中:
確認(rèn)了 echarts.js 文件的路徑和權(quán)限正確。
確認(rèn) httpStatic 配置,確保靜態(tài)文件路徑設(shè)置正確。
手動(dòng)測(cè)試 echarts.js 文件,確保文件可以正確加載。
使用瀏覽器開(kāi)發(fā)者工具的網(wǎng)絡(luò)標(biāo)簽頁(yè),確認(rèn) echarts.js 文件被正確加載。
檢查瀏覽器控制臺(tái),查看報(bào)錯(cuò)信息
修改template代碼
動(dòng)態(tài)創(chuàng)建 script 標(biāo)簽,確保 echarts.js 在 mounted 鉤子之前加載。
使用 window.echarts 而不是動(dòng)態(tài)導(dǎo)入,確保 echarts 在腳本加載完成后可用。
-------------------------------------------或者------------------------------------------------
通過(guò)訪問(wèn)cdn,實(shí)現(xiàn)echart.js加載。只需要將地址改為如下即可。
echartsScript.src = 'https://cdn.jsdelivr.net/npm/echarts/dist/echarts.min.js'; // 使用 CDN 加載 ECharts
----------------------------------------多個(gè)echart-------------------------------------------------
<template>
  <div>
    <!-- 創(chuàng)建四個(gè) div 容器用于放置 ECharts 圖表,設(shè)置寬度和高度 -->
    <div id="chart11" style="width: 600px; height: 400px;"></div>
    <div id="chart12" style="width: 600px; height: 400px;"></div>
    <div id="chart13" style="width: 600px; height: 400px;"></div>
    <div id="chart14" style="width: 600px; height: 400px;"></div>
  </div>
</template>

<script>
export default {
  mounted() {
    // 動(dòng)態(tài)加載 ECharts 庫(kù)
    if (!window.echarts) {
      const echartsScript = document.createElement('script');
      echartsScript.src = 'echarts.js'; // 使用 CDN 加載 ECharts
      echartsScript.async = true; // 異步加載腳本
      echartsScript.onload = () => {
        this.initCharts();
      };
      document.head.appendChild(echartsScript); // 將 script 標(biāo)簽添加到文檔頭部
    } else {
      this.initCharts();
    }
  },

  methods: {
    initCharts() {
      try {
        const echarts = window.echarts;

        // 初始化第一個(gè)圖表(柱狀圖)
        const chart11 = echarts.init(document.getElementById('chart11'));
        const option1 = this.getBarChartOption();
        chart11.setOption(option1);

        // 初始化第二個(gè)圖表(折線圖)
        const chart12 = echarts.init(document.getElementById('chart12'));
        const option2 = this.getLineChartOption();
        chart12.setOption(option2);

        // 初始化第三個(gè)圖表(餅圖)
        const chart13 = echarts.init(document.getElementById('chart13'));
        const option3 = this.getPieChartOption();
        chart13.setOption(option3);

        // 初始化第四個(gè)圖表(散點(diǎn)圖)
        const chart14 = echarts.init(document.getElementById('chart14'));
        const option4 = this.getScatterChartOption();
        chart14.setOption(option4);

        console.log("ECharts charts rendered successfully"); // 日志輸出,確認(rèn)圖表渲染成功
      } catch (error) {
        console.error("Error initializing or rendering ECharts:", error); // 錯(cuò)誤處理
      }
    },

    // 獲取柱狀圖配置
    getBarChartOption() {
      return {
        title: {
          text: '柱狀圖動(dòng)畫(huà)延遲'
        },
        legend: {
          data: ['銷(xiāo)量1', '銷(xiāo)量2']
        },
        tooltip: {
          trigger: 'axis',
          axisPointer: {
            type: 'shadow'
          }
        },
        xAxis: {
          data: this.generateXAxisData(100),
          splitLine: {
            show: false
          }
        },
        yAxis: {},
        series: [
          {
            name: '銷(xiāo)量1',
            type: 'bar',
            data: this.generateData(100, Math.sin),
            emphasis: {
              focus: 'series'
            },
            animationDelay: (idx) => idx * 10
          },
          {
            name: '銷(xiāo)量2',
            type: 'bar',
            data: this.generateData(100, Math.cos),
            emphasis: {
              focus: 'series'
            },
            animationDelay: (idx) => idx * 10 + 100
          }
        ],
        animationEasing: 'elasticOut',
        animationDuration: 1000,
        animationDelayUpdate: (idx) => idx * 5
      };
    },

    // 獲取折線圖配置
    getLineChartOption() {
      return {
        title: {
          text: '折線圖動(dòng)畫(huà)延遲'
        },
        legend: {
          data: ['銷(xiāo)量3', '銷(xiāo)量4']
        },
        tooltip: {
          trigger: 'axis',
          axisPointer: {
            type: 'cross'
          }
        },
        xAxis: {
          data: this.generateXAxisData(100),
          splitLine: {
            show: false
          }
        },
        yAxis: {},
        series: [
          {
            name: '銷(xiāo)量3',
            type: 'line',
            data: this.generateData(100, (i) => Math.sin(i / 5) * (i / 5 - 10) + i / 6),
            emphasis: {
              focus: 'series'
            },
            animationDelay: (idx) => idx * 10
          },
          {
            name: '銷(xiāo)量4',
            type: 'line',
            data: this.generateData(100, (i) => Math.cos(i / 5) * (i / 5 - 10) + i / 6),
            emphasis: {
              focus: 'series'
            },
            animationDelay: (idx) => idx * 10 + 100
          }
        ],
        animationEasing: 'elasticOut',
        animationDuration: 1000,
        animationDelayUpdate: (idx) => idx * 5
      };
    },

    // 獲取餅圖配置
    getPieChartOption() {
      return {
        title: {
          text: '餅圖示例'
        },
        tooltip: {
          trigger: 'item'
        },
        legend: {
          orient: 'vertical',
          left: 'left'
        },
        series: [
          {
            name: '訪問(wèn)來(lái)源',
            type: 'pie',
            radius: '50%',
            data: [
              { value: 1048, name: '搜索引擎' },
              { value: 735, name: '直接訪問(wèn)' },
              { value: 580, name: '郵件營(yíng)銷(xiāo)' },
              { value: 484, name: '聯(lián)盟廣告' },
              { value: 300, name: '視頻廣告' }
            ],
            emphasis: {
              itemStyle: {
                shadowBlur: 10,
                shadowOffsetX: 0,
                shadowColor: 'rgba(0, 0, 0, 0.5)'
              }
            }
          }
        ]
      };
    },

    // 獲取散點(diǎn)圖配置
    getScatterChartOption() {
      return {
        title: {
          text: '散點(diǎn)圖示例'
        },
        tooltip: {
          trigger: 'axis',
          axisPointer: {
            type: 'cross'
          }
        },
        xAxis: {
          type: 'value',
          scale: true,
          splitLine: {
            show: false
          }
        },
        yAxis: {
          type: 'value',
          scale: true,
          splitLine: {
            show: false
          }
        },
        series: [
          {
            name: '散點(diǎn)1',
            type: 'scatter',
            data: this.generateScatterData(100)
          },
          {
            name: '散點(diǎn)2',
            type: 'scatter',
            data: this.generateScatterData(100, (i) => i * 2)
          }
        ]
      };
    },

    // 生成 X 軸數(shù)據(jù)
    generateXAxisData(count) {
      return Array.from({ length: count }, (_, i) => `類(lèi)目${i}`);
    },

    // 生成數(shù)據(jù)
    generateData(count, func) {
      return Array.from({ length: count }, (_, i) => (func(i / 5) * (i / 5 - 10) + i / 6) * 5);
    },

    // 生成散點(diǎn)圖數(shù)據(jù)
    generateScatterData(count, func = (i) => i) {
      return Array.from({ length: count }, (_, i) => [func(i), Math.random() * 100]);
    }
  }
}
</script>

<style>
/* 定義樣式 */
#chart11, #chart12, #chart13, #chart14 {
  width: 600px;
  height: 400px;
  margin-bottom: 20px;
}
</style>

 浙公網(wǎng)安備 33010602011771號(hào)