
Qwt 編譯 配置 使用
 QWT,全稱是Qt Widgets for Technical Applications,是一個基于LGPL版權協議的開源項目,可生成各種統計圖。它為具有技術專業背景的程序提供GUI組件和一組實用類,其目標是以基于2D方式的窗體部件來顯示數據,數據源以數值,數組或一組浮點數等方式提供,輸出方式可以是Curves(曲線),Slider(滾動條),Dials(圓盤),Compasses(儀表盤)等等。該工具庫基于Qt開發,所以也繼承了Qt的跨平臺特性。
QWT,全稱是Qt Widgets for Technical Applications,是一個基于LGPL版權協議的開源項目,可生成各種統計圖。它為具有技術專業背景的程序提供GUI組件和一組實用類,其目標是以基于2D方式的窗體部件來顯示數據,數據源以數值,數組或一組浮點數等方式提供,輸出方式可以是Curves(曲線),Slider(滾動條),Dials(圓盤),Compasses(儀表盤)等等。該工具庫基于Qt開發,所以也繼承了Qt的跨平臺特性。
環境:VS2010 + Qt4.8.6
(本示例基于QT4,如用QT5可參考更改)
1、下載:
QWT下載地址:http://sourceforge.net/projects/qwt/files/qwt/
QWT版本:6.1.2
相關文件:qwt-6.1.2.zip(源碼);qwt-6.1.2.pdf(說明文檔);qwt-6.1.2.qch(幫助文檔。可以將該幫助文檔添加到Qt Assistant中.首先將該幫助文檔復制到C:\Qt\4.8.6\doc\qch中,打開Qt Assistant,編輯->首選項->文檔->添加,選中qwt-6.1.2.qch確定即可);
qwt-6.1.2.zip中包括:designer目錄:存放QWT插件的源碼;doc目錄:存放幫助文檔;examples目錄:存放QWT的示例(源碼、可執行程序);src目錄:存放QWT的源碼;textengines目錄:存放數學指標語言的文本驅動引擎代碼;還包含一些pro等工程文件等。
2、編譯:
1) 編譯QWT:打開Visual Studio命令提示(2010)窗口,先進入QWT的ZIP解壓到目錄qwt-6.1.2(即下載的qwt-6.1.2.zip解壓為qwt-6.1.2目錄),即帶有QWT.PRO文件的目錄。執行命令:
cd C:\ qwt-6.1.2
qmake qwt.pro
nmake
經過漫長的等待,編譯成功后,在C:\qwt-6.1.2目錄下的lib子目錄下應該生成了后面需要的qwt.dll、qwt.lib、qwtd.dll、qwtd.lib文件;在C:\qwt-6.1.2\designer\plugins\designer目錄下生成了qwt_designer_plugin.dll、qwt_designer_plugin.lib等文件。這些文件在后面配置QT Designer時會用到。
接著執行:
nmake install
命令執行成功后,將在C:\qwt-6.1.2目錄下生成include子目錄,里面包含98個.h頭文件,該文件夾后面配置時也會用到。
之前的版本,在編譯時需要單獨編譯designer目錄,新版本已經不需要了,如果是6.1.0及以前的版本,還需執行下面的第2步,如果用的是6.1.2就可以跳過這步,直接進行第3步。
2) 編譯designer:
cd designer
qmake designer.pro
nmake
這一步的目的是在C:\QWT\designer\plugins\designer目錄下生成qwt_designer_plugin.dll、qwt_designer_plugin.lib;
3) 編譯examples:
cd ..
cd examples
qmake examples.pro
nmake
--漫長等待,成功后,在examples\bin目錄下可以找到實例的可執行文件學習。
3、配置
1) 將C:\qwt-6.1.2\lib下的qwt.dll、qwtd.dll、qwtd.pdb拷貝到C:\QT\4.8.6\bin下,將qwtd.lib、qwt.lib拷貝C:\QT\4.8.6\lib下(以qt安裝目錄C:\QT\4.8.6為例)。
2) 將C:\ qwt-6.1.2\designer\plugins\designer目錄下的qwt_designer_plugin.dll、qwt_designer_plugin.lib拷貝到C:\Qt\4.8.6\plugins\designer目錄下。
3) 將C:\Qwt-6.1.2目錄下的include文件夾(或該目錄下的src文件夾下的h和cpp文件)復制到C:\QT\4.8.6\include目錄下,并將其重命名為Qwt。
4) 至此,QWT安裝配置完成,打開QT Designer,在Widget box可以看到Qwt。
4、使用
在VS中,新建項目,在項目的解決方案資源管理器中選中主項目,點右鍵->屬性,然后進行配置(根據生成方式Debug或者Release略有不同):
(1)屬性-<配置屬性-<C/C++-<常規,附加包含目錄:$(QTDIR)\include\QWT
(2)屬性-<配置屬性-<鏈接器-<輸入,Debug方式附加依賴項:C:\QT\4.8.6\lib\qwtd.lib;Release方式附加依賴項:C:\QT\4.8.6\lib\qwt.lib
(3)屬性-<配置屬性-<C/C++-<預處理器,預處理器定義:QWT_DLL
所有工作準備完成之后,寫一個demo,測試一下:

5、示例(原文:http://blog.csdn.net/tengweitw/article/details/41911035)
首先,我們新建一個Qt應用程序,然后一路默認即可。這時,你會發現總共有:mainwindow.h,mainwindow.cpp,main.cpp,mainwindow.ui四個文件。
然后,選中項目,添加新文件,添加一個c++類,我們假設命名為PlotLines,基類選擇QwtPlot,選擇繼承自QWidget。
接著,在pro文件中添加
INCLUDEPATH +=D:\Qt\Qt5.3.0\5.3\msvc2010_opengl\include\QWT
LIBS+= -lqwtd
注意,我這里是將繪制曲線單獨用一個類PlotLines表示的,而不是向參考實例一樣是直接放在其他類的內部。所以這里我們需要在類的頭文件中添加關鍵性語句:
#define QWT_DLL
最后,在主文件main.cpp中添加我們類的頭文件,并在函數中生成該類的實例并顯示,修改后的main.cpp文件如下所示:
 1 #include "mainwindow.h"
 2 #include <QApplication>
 3 #include"plotlines.h"
 4 int main(int argc, char *argv[])
 5 {
 6     QApplication a(argc, argv);
 7 //    MainWindow w;//這里的主窗口我們沒有使用,當然也可以在主窗口中顯示曲線
 8 //    w.show();
 9     PlotLines line;
10     line.show();
11     return a.exec();
12 }
PlotLines.h文件如下:
 1 #ifndef PLOTLINES_H
 2 #define PLOTLINES_H
 3 #define QWT_DLL
 4 #include<qwt_plot.h>
 5 #include <qwt_plot_layout.h>
 6 #include <qwt_plot_canvas.h>
 7 #include <qwt_plot_renderer.h>
 8 #include <qwt_plot_grid.h>
 9 #include <qwt_plot_histogram.h>
10 #include <qwt_plot_curve.h>
11 #include <qwt_plot_zoomer.h>
12 #include <qwt_plot_panner.h>
13 #include <qwt_plot_magnifier.h>
14 #include <qwt_legend.h>
15 #include <qwt_legend_label.h>
16 #include <qwt_column_symbol.h>
17 #include <qwt_series_data.h>
18 #include <qpen.h>
19 #include <qwt_symbol.h>
20 #include <qwt_picker_machine.h>
21 class PlotLines : public QwtPlot
22 {
23     Q_OBJECT
24 public:
25     explicit PlotLines(QWidget *parent = 0);
26 private Q_SLOTS:
27     void showItem(const QVariant &itemInfo, bool on);//點擊圖例,顯示相應的曲線
28 };
29
30 #endif // PLOTLINES_H
PlotLines.cpp文件如下:
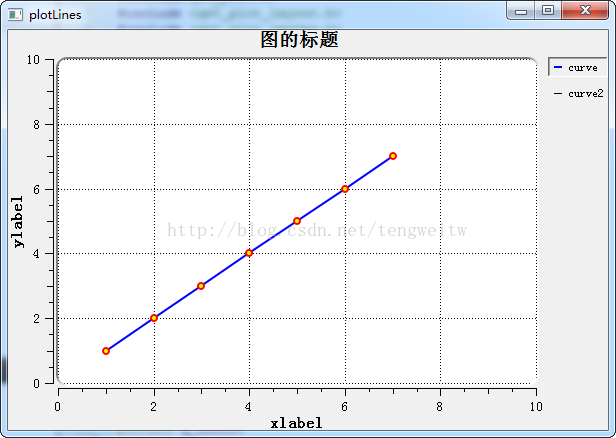
 1 #include "plotlines.h"
 2
 3 PlotLines::PlotLines(QWidget *parent) :
 4     QwtPlot(parent)
 5 {
 6     setTitle("圖的標題");
 7 //---------設置畫布---------//
 8     QwtPlotCanvas *canvas=new QwtPlotCanvas();
 9     canvas->setPalette(Qt::white);
10     canvas->setBorderRadius(10);
11     setCanvas( canvas );
12     plotLayout()->setAlignCanvasToScales( true );
13
14     //-----------設置x,y坐標和范圍--------------//
15     setAxisTitle( QwtPlot::yLeft, "ylabel" );
16     setAxisTitle( QwtPlot::xBottom, "xlabel" );
17     setAxisScale(QwtPlot::yLeft,0.0,10.0);
18     setAxisScale(QwtPlot::xBottom,0.0,10.0);
19
20     //----------------設置柵格線-------------------//
21     QwtPlotGrid *grid = new QwtPlotGrid;
22     grid->enableX( true );//設置網格線
23     grid->enableY( true );
24     grid->setMajorPen( Qt::black, 0, Qt::DotLine );
25     grid->attach( this );
26
27     //-----------------開始畫圖----------------------//
28     QwtPlotCurve *curve=new QwtPlotCurve("curve");
29    // curve->setTitle( "信道"+QString( "%1 " ).arg( i+1));
30     curve->setPen(Qt::blue,2);//設置曲線顏色 粗細
31     curve->setRenderHint(QwtPlotItem::RenderAntialiased,true);//線條光滑化
32
33     QwtSymbol *symbol = new QwtSymbol( QwtSymbol::Ellipse,
34     QBrush( Qt::yellow ), QPen( Qt::red, 2 ), QSize( 6, 6) );//設置樣本點的顏色、大小
35     curve->setSymbol( symbol );//添加樣本點形狀
36
37     QPolygonF points1, points2;//輸入節點數據QPointF(x,y)
38     points1<<QPointF(1,1)<<QPointF(2,2)<<QPointF(3,3)<<QPointF(4,4)<<QPointF(5,5)<<QPointF(6,6)<<QPointF(7,7);
39     points2<<QPointF(1,2)<<QPointF(2,3)<<QPointF(3,4)<<QPointF(4,5)<<QPointF(5,6)<<QPointF(6,7)<<QPointF(7,8);
40     curve->setSamples(points1);
41     curve->attach( this );
42     curve->setLegendAttribute(curve->LegendShowLine);//顯示圖例的標志,這里顯示線的顏色。
43
44     //曲線2的形狀采用默認,即不單獨設置畫筆的顏色、樣本點的顯示
45     QwtPlotCurve *curve2=new QwtPlotCurve("curve2");
46     curve2->setSamples(points2);
47     curve2->attach( this );
48     curve2->setLegendAttribute(curve->LegendShowLine);
49
50 //--------------設置圖例可以被點擊來確定是否顯示曲線-----------------------//
51     QwtLegend *legend = new QwtLegend;
52     legend->setDefaultItemMode( QwtLegendData::Checkable );//圖例可被點擊
53     insertLegend( legend, QwtPlot::RightLegend );
54     connect( legend, SIGNAL( checked( const QVariant &, bool, int ) ),
55         SLOT( showItem( const QVariant &, bool ) ) );//點擊圖例操作
56
57     QwtPlotItemList items = itemList( QwtPlotItem::Rtti_PlotCurve );//獲取畫了多少條曲線,如果為獲取其他形狀,注意改變參數
58    //  qDebug()<<items;
59     for ( int i = 0; i < items.size(); i++ )
60     {
61         if ( i == 0 )
62         {
63             const QVariant itemInfo = itemToInfo( items[i] );
64             QwtLegendLabel *legendLabel =
65                 qobject_cast<QwtLegendLabel *>( legend->legendWidget( itemInfo ) );
66             if ( legendLabel )
67                 legendLabel->setChecked( true );//
68             items[i]->setVisible( true );
69         }
70         else
71         {
72             items[i]->setVisible( false );
73         }
74     }
75     this->resize(600,400);
76     this->replot();
77     setAutoReplot( true );//設置自動重畫,相當于更新
78 }
79 //點擊圖例,顯示相應的曲線
80 void PlotLines::showItem(const QVariant &itemInfo, bool on)
81 {
82     QwtPlotItem *plotItem = infoToItem( itemInfo );
83     if ( plotItem )
84         plotItem->setVisible( on );
85 }
其他的文件沒有作任何改變,在此就不列出來了。顯示結果如下圖:
1、初始界面如下:
2、點擊右上角的圖例后:

本文所創建的PlotLines類,完成的功能如下:
1、坐標軸的繪制
2、根據數據點繪制相應的曲線
3、右上角的圖例可以點擊,并顯示或隱藏對應曲線

 浙公網安備 33010602011771號